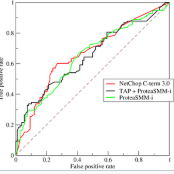
Given two data distributions and a test score function, the Receiver Operating Characteristic (ROC) curve shows how well such a score separates two distributions. However, can the ROC curve be used as a measure of discrepancy between two distributions? This paper shows that when the data likelihood ratio is used as the test score, the arc length of the ROC curve gives rise to a novel $f$-divergence measuring the differences between two data distributions. Approximating this arc length using a variational objective and empirical samples leads to empirical risk minimization with previously unknown loss functions. We provide a Lagrangian dual objective and introduce kernel models into the estimation problem. We study the non-parametric convergence rate of this estimator and show under mild smoothness conditions of the real arctangent density ratio function, the rate of convergence is $O_p(n^{-\beta/4})$ ($\beta \in (0,1]$ depends on the smoothness).
翻译:在两种数据分布和测试分数函数下, 收件人操作特征(ROC) 曲线可以显示这种分数将两种分数分离的好坏。 但是, ROC 曲线可以用来衡量两种分数之间的差异吗? 本文显示, 当数据概率比率被用作测试分数时, ROC 曲线的弧长度会产生一种新的美元差异, 测量两种数据分布的差异。 使用变量目标来匹配这一弧长度, 实验样本可以导致用先前未知的损失函数来尽量减少实验风险。 我们提供了拉格朗格双向目标, 并在估算问题中引入内核模型。 我们研究这个估计值的非参数趋同率, 并在实际正值密度比值的温和平稳条件下显示实际正值密度比值的趋同率率是$_ p( n ⁇ -\\\beta/4} ($_ beta $_ p (n, 0, 1美元) 取决于平滑度 。


