Given that social interactions drive the spread of infectious diseases amongst humans, one anticipates that human mobility in Belgium affected the spread of COVID-19 during both 2020 "waves". Measures against this spread in turn influenced mobility patterns. In this study, we analyse and mutually compare time series of COVID-19-related data and mobility data across Belgium's 43 arrondissements (NUTS 3 level). First, we confirm that overall mobility did in fact change significantly over the consecutive stages of the pandemic. So doing, we define a quantity that represents the degree of mobility between two arrondissements: the "connectivity index". Second, we analyse spatio-temporal COVID-19-related incidence and hospitalisation data using dynamic time warping and time-lagged cross-correlation. This allows us to quantify time lag and morphological similarities between localised waves. Third, by coupling those analyses, we conclude that mobility between arrondissements is in fact indicative of the spatio-temporal spread of COVID-19 in Belgium, as was previously shown for other EU countries. This conclusion supports the need for mobility analysis and/or control during a pandemic, and by extension motivates the development of our spatially explicit Belgian metapopulation model.
翻译:鉴于社会互动驱动了人类传染病的传播,人们预计2020年两次“波”期间比利时人的流动性都会影响COVID-19的传播。针对这种传播的措施反过来又会影响流动模式。在本研究中,我们分析并相互比较比利时43个地区(NUTS 3级)与COVID-19有关的数据和流动数据的时间序列。首先,我们确认总体流动性在大流行病连续各阶段实际上确实发生了重大变化。因此,我们界定了一种数量,它代表了两个地区(即“连接指数”)之间的流动性程度。第二,我们利用动态时间扭曲和时间滞后的交叉关系,分析与COVID-19有关的事件和住院化数据。这使我们能够量化当地波浪之间的时间滞后和形态相似性。第三,通过将这些分析结合起来,我们得出的结论是,在比利时两个地区之间的流动性事实上代表着COVID-19-19在比利时的瞬间传播程度。正如以前为其他欧盟国家所显示的那样,这一结论支持了我们通过模型进行空间动态分析及空间动态的动态。
相关内容
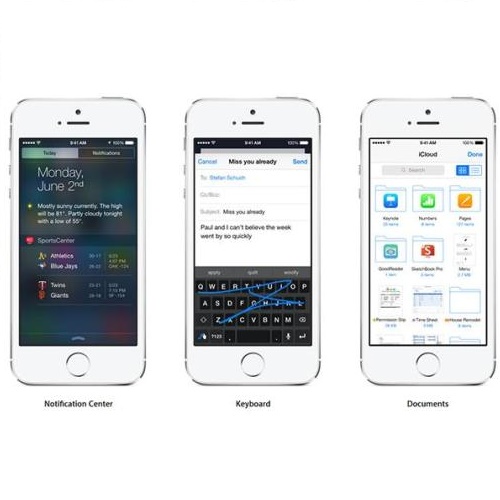
- Today (iOS and OS X): widgets for the Today view of Notification Center
- Share (iOS and OS X): post content to web services or share content with others
- Actions (iOS and OS X): app extensions to view or manipulate inside another app
- Photo Editing (iOS): edit a photo or video in Apple's Photos app with extensions from a third-party apps
- Finder Sync (OS X): remote file storage in the Finder with support for Finder content annotation
- Storage Provider (iOS): an interface between files inside an app and other apps on a user's device
- Custom Keyboard (iOS): system-wide alternative keyboards
Source: iOS 8 Extensions: Apple’s Plan for a Powerful App Ecosystem


