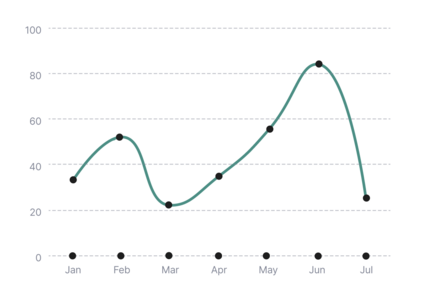
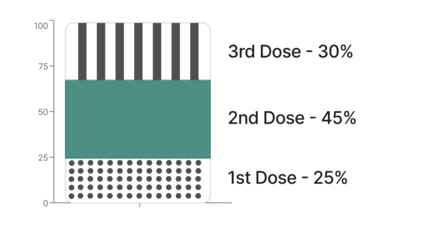
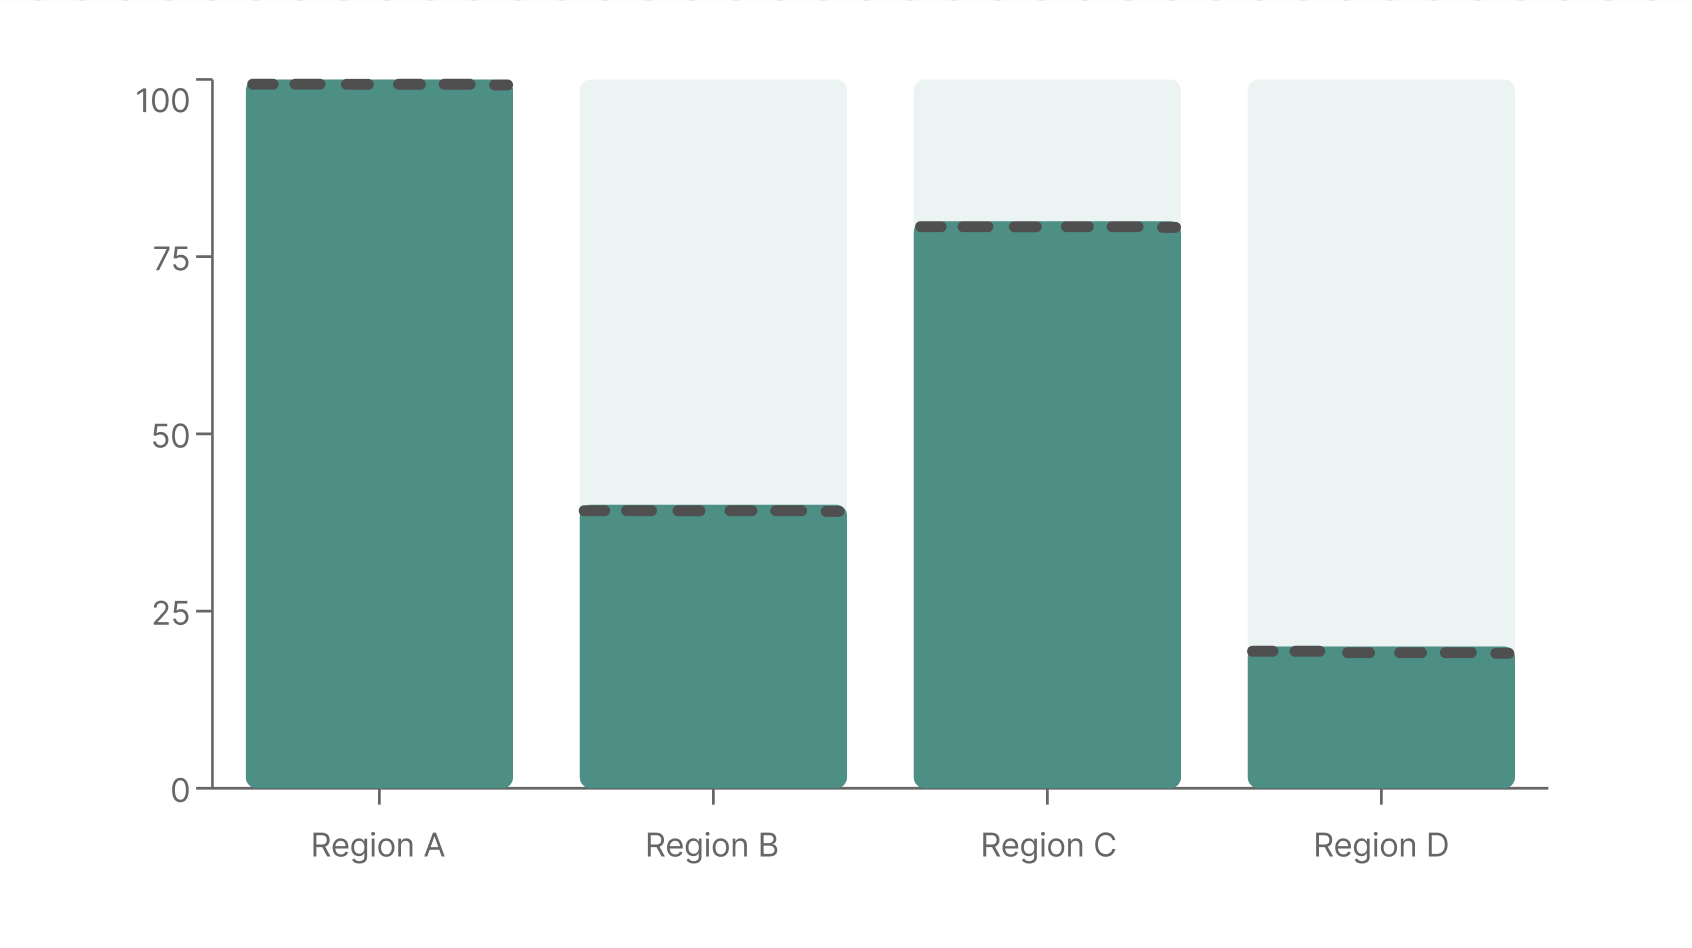
Tactile graphics are often adapted from visual chart designs, yet many of these encodings do not translate effectively to non-visual exploration. Blind and low-vision (BLV) people employ a variety of physical strategies such as measuring lengths with fingers or scanning for texture differences to interpret tactile charts. These observations suggest an opportunity to move beyond direct visual translation and toward a tactile-first design approach. We outline a speculative tactile design framework that explores how data analysis tasks may align with tactile strategies and encoding choices. While this framework is not yet validated, it offers a lens for generating tactile-first chart designs and sets the stage for future empirical exploration. We present speculative mockups to illustrate how the Tactile Perceptual Grammar might guide the design of an accessible COVID-19 dashboard. This scenario illustrates how the grammar can guide encoding choices that better support comparison, trend detection, and proportion estimation in tactile formats. We conclude with design implications and a discussion of future validation through co-design and task-based evaluation.
翻译:暂无翻译