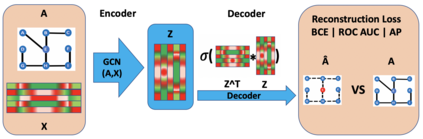
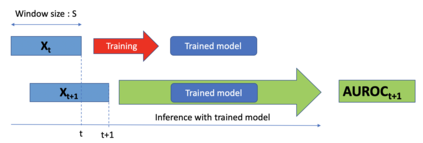
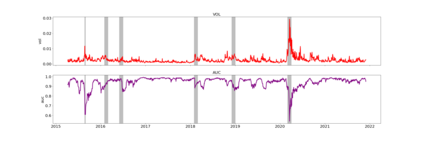
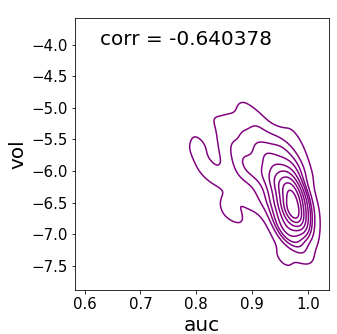
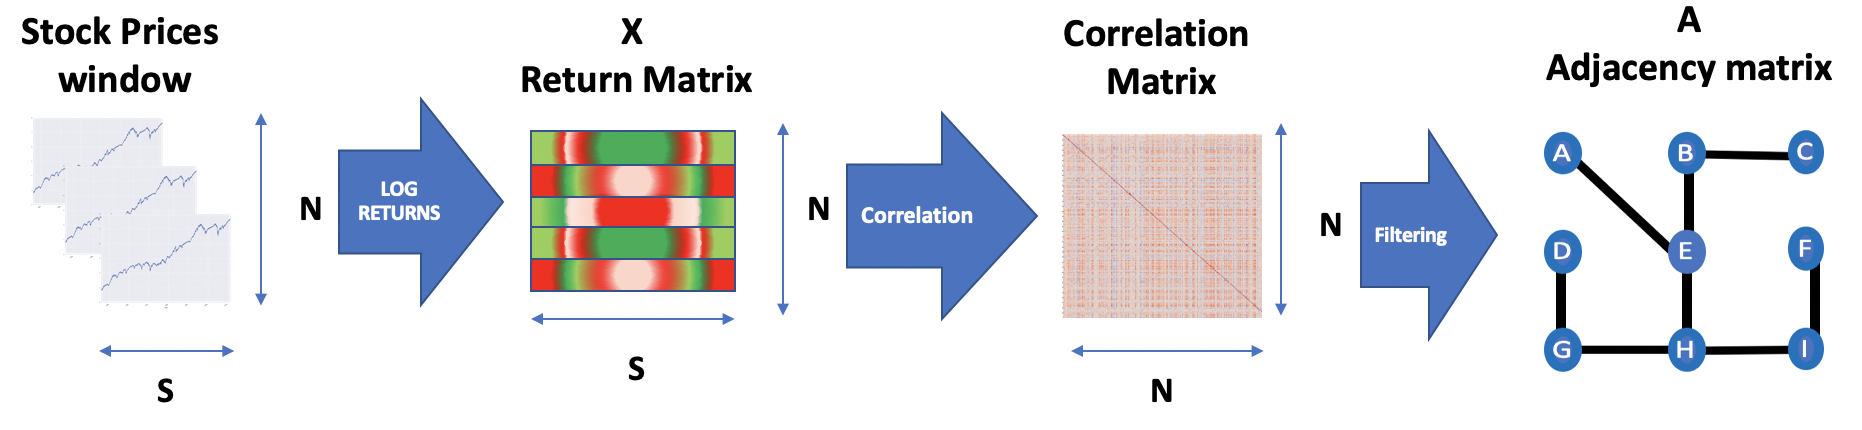
Understanding stock market instability is a key question in financial management as practitioners seek to forecast breakdowns in asset co-movements which expose portfolios to rapid and devastating collapses in value. The structure of these co-movements can be described as a graph where companies are represented by nodes and edges capture correlations between their price movements. Learning a timely indicator of co-movement breakdowns (manifested as modifications in the graph structure) is central in understanding both financial stability and volatility forecasting. We propose to use the edge reconstruction accuracy of a graph auto-encoder (GAE) as an indicator for how spatially homogeneous connections between assets are, which, based on financial network literature, we use as a proxy to infer market volatility. Our experiments on the S&P 500 over the 2015-2022 period show that higher GAE reconstruction error values are correlated with higher volatility. We also show that out-of-sample autoregressive modeling of volatility is improved by the addition of the proposed measure. Our paper contributes to the literature of machine learning in finance particularly in the context of understanding stock market instability.
翻译:了解股市不稳定性是财务管理的一个关键问题,因为从业者试图预测资产共同流动的崩溃,使投资组合面临迅速和毁灭性的价值崩溃。这些共同流动的结构可以描述为一个图表,其中各公司以节点和边缘代表其价格波动之间的相互关系。学习一个及时的共同移动崩溃指标(因图结构的修改而成型)对于了解金融稳定性和波动预测都至关重要。我们提议使用图表自动计算器(GAE)的边缘重建精度作为资产间空间均匀联系的指标,根据金融网络文献,我们使用该指标作为推断市场波动的代理。我们在2015-2022年期间对S & P 500的实验表明,GAE重建误差值较高与更大的波动性相关。我们还表明,通过添加拟议措施,将改进波动的外表自动递增模型。我们的文件有助于在金融领域进行机器学习的文献,特别是在了解股票市场不稳定性的背景下。