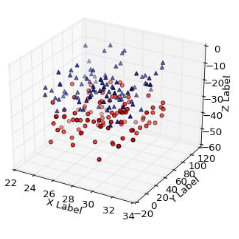
We examine several currently used techniques for visualizing complex-valued functions applied to modular forms. We plot several examples and study the benefits and limitations of each technique. We then introduce a method of visualization that can take advantage of colormaps in Python's matplotlib library, describe an implementation, and give more examples. Much of this discussion applies to general visualizations of complex-valued functions in the plane.
翻译:我们考察了目前用于模块形式的复杂价值函数的可视化技术。我们绘制了几个实例并研究了每种技术的效益和局限性。然后我们引入了一种可视化方法,可以利用Python的 Mattplotlib 图书馆中的色谱图,描述一个实施,并给出更多实例。这些讨论大多适用于对平面上复杂价值函数的一般可视化。
相关内容
专知会员服务
36+阅读 · 2019年10月17日
Arxiv
5+阅读 · 2019年8月27日
Arxiv
8+阅读 · 2018年2月6日


