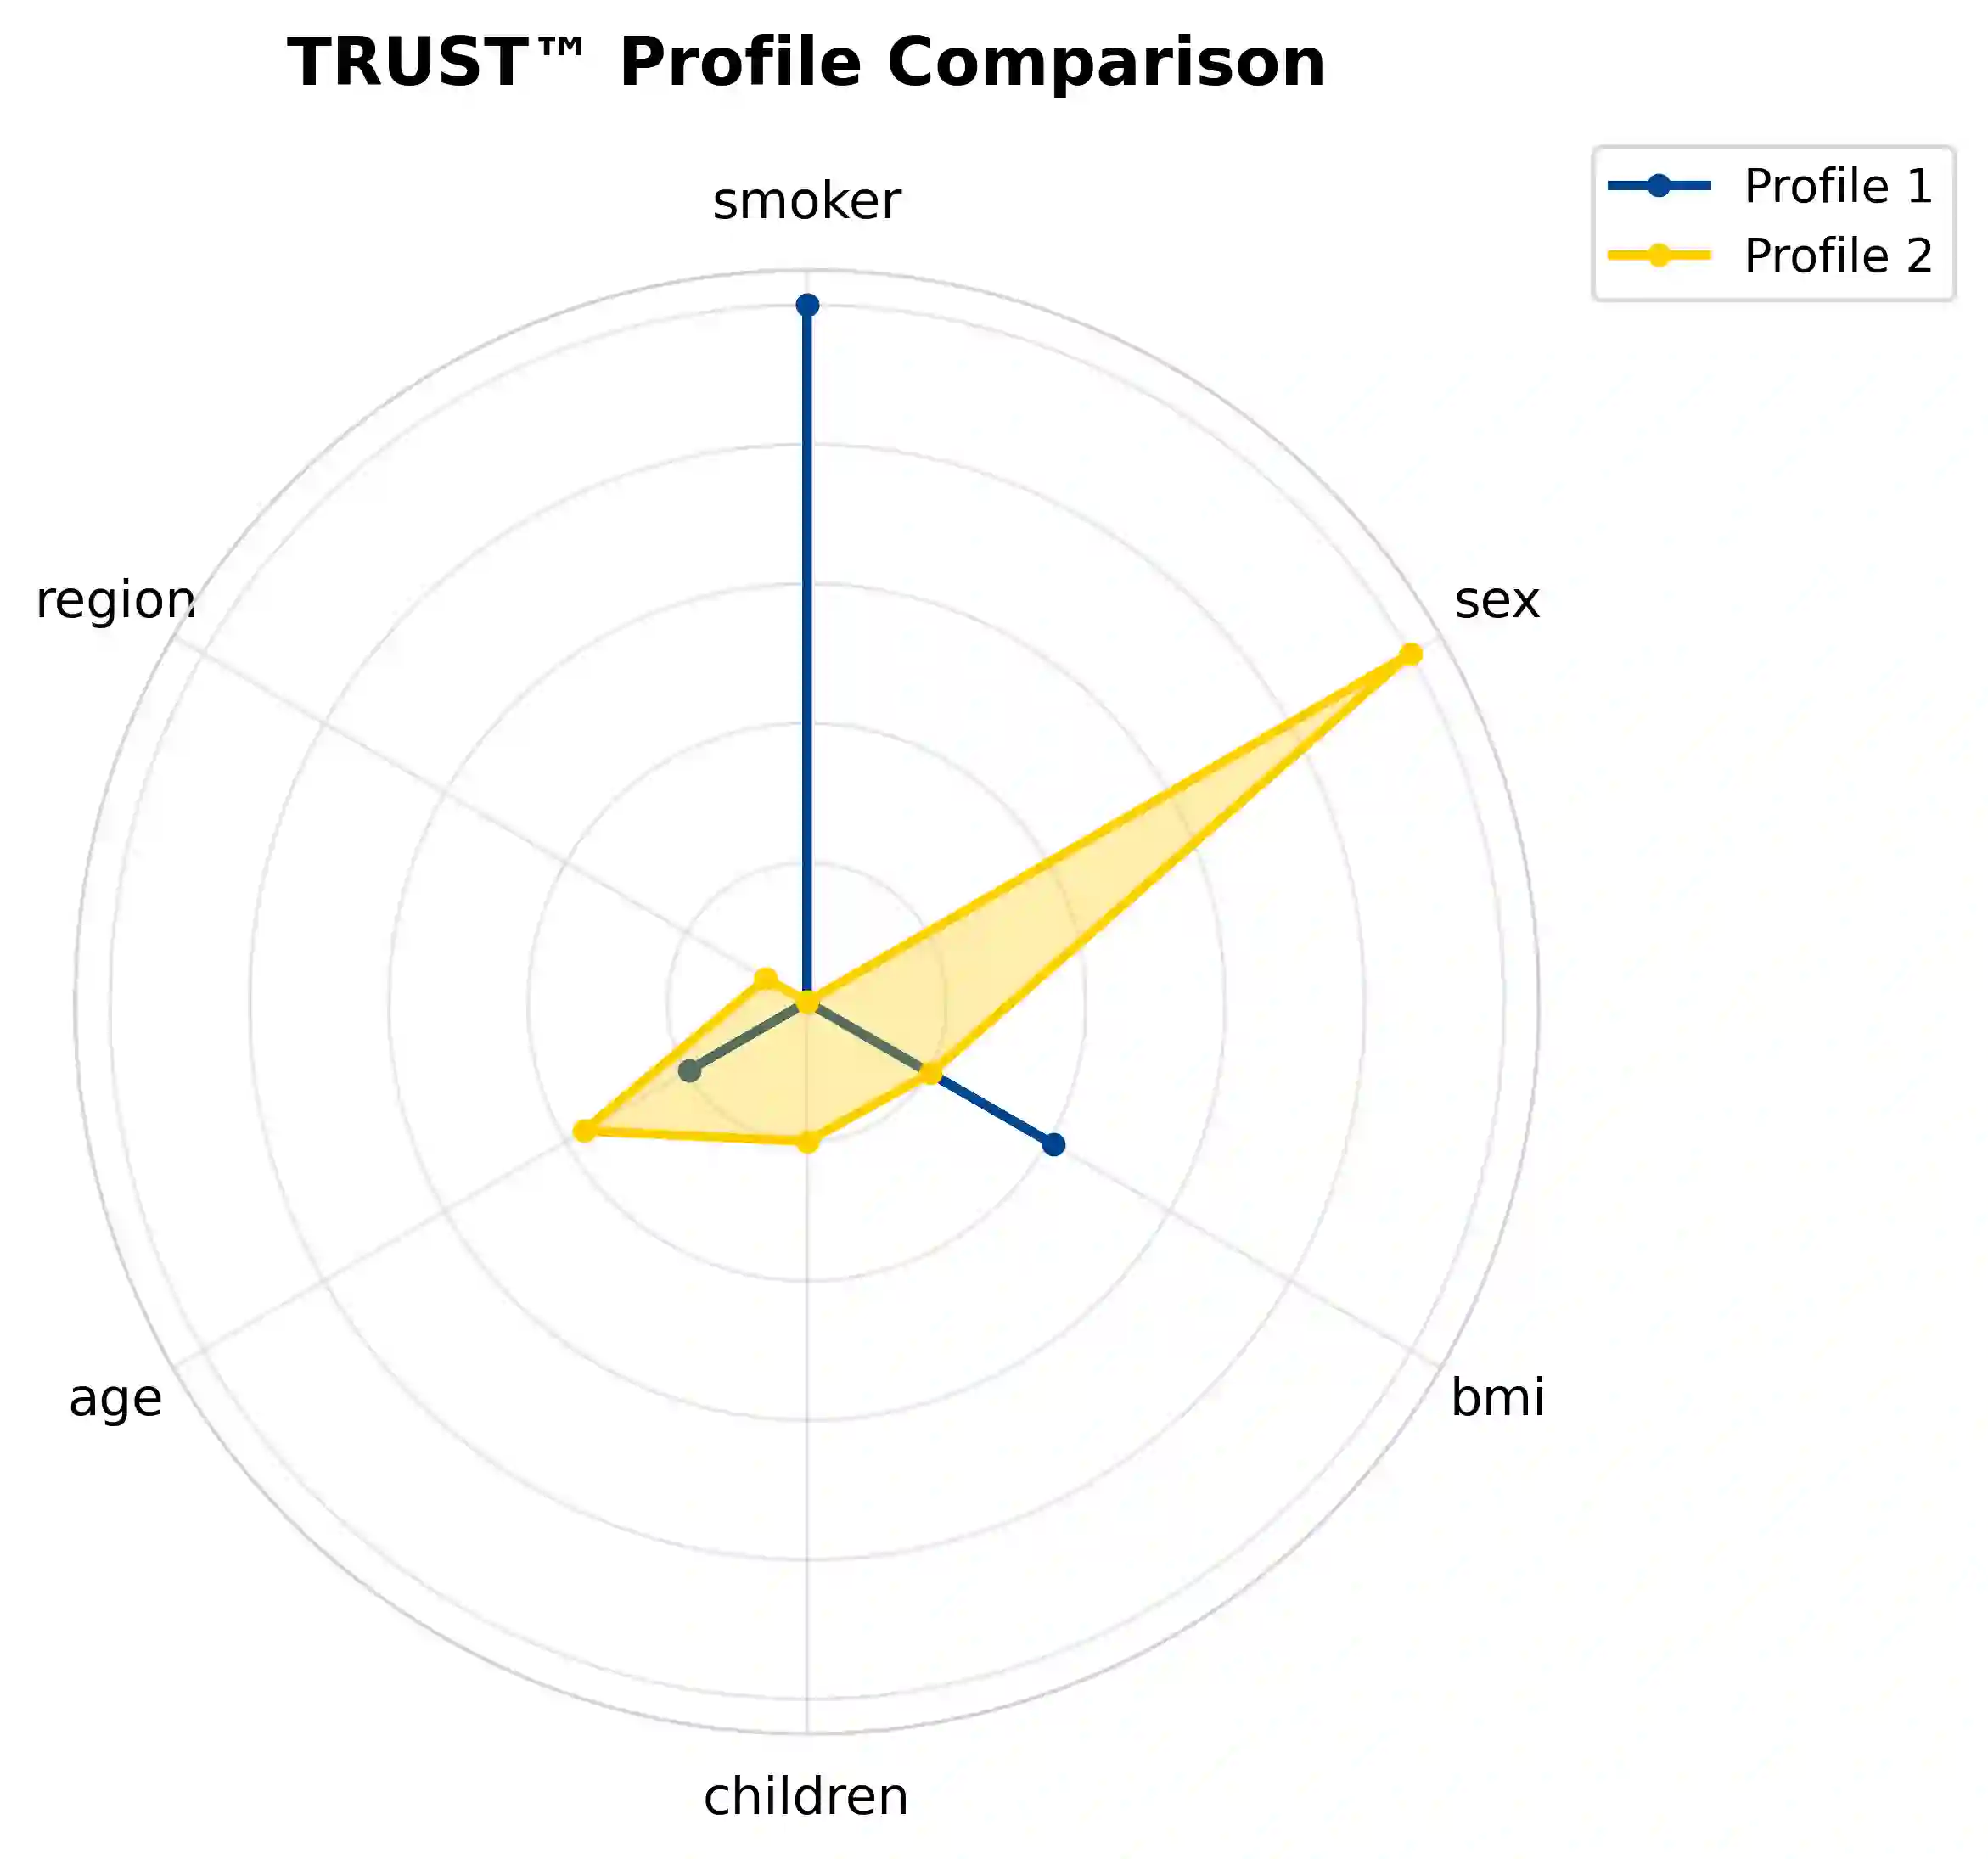
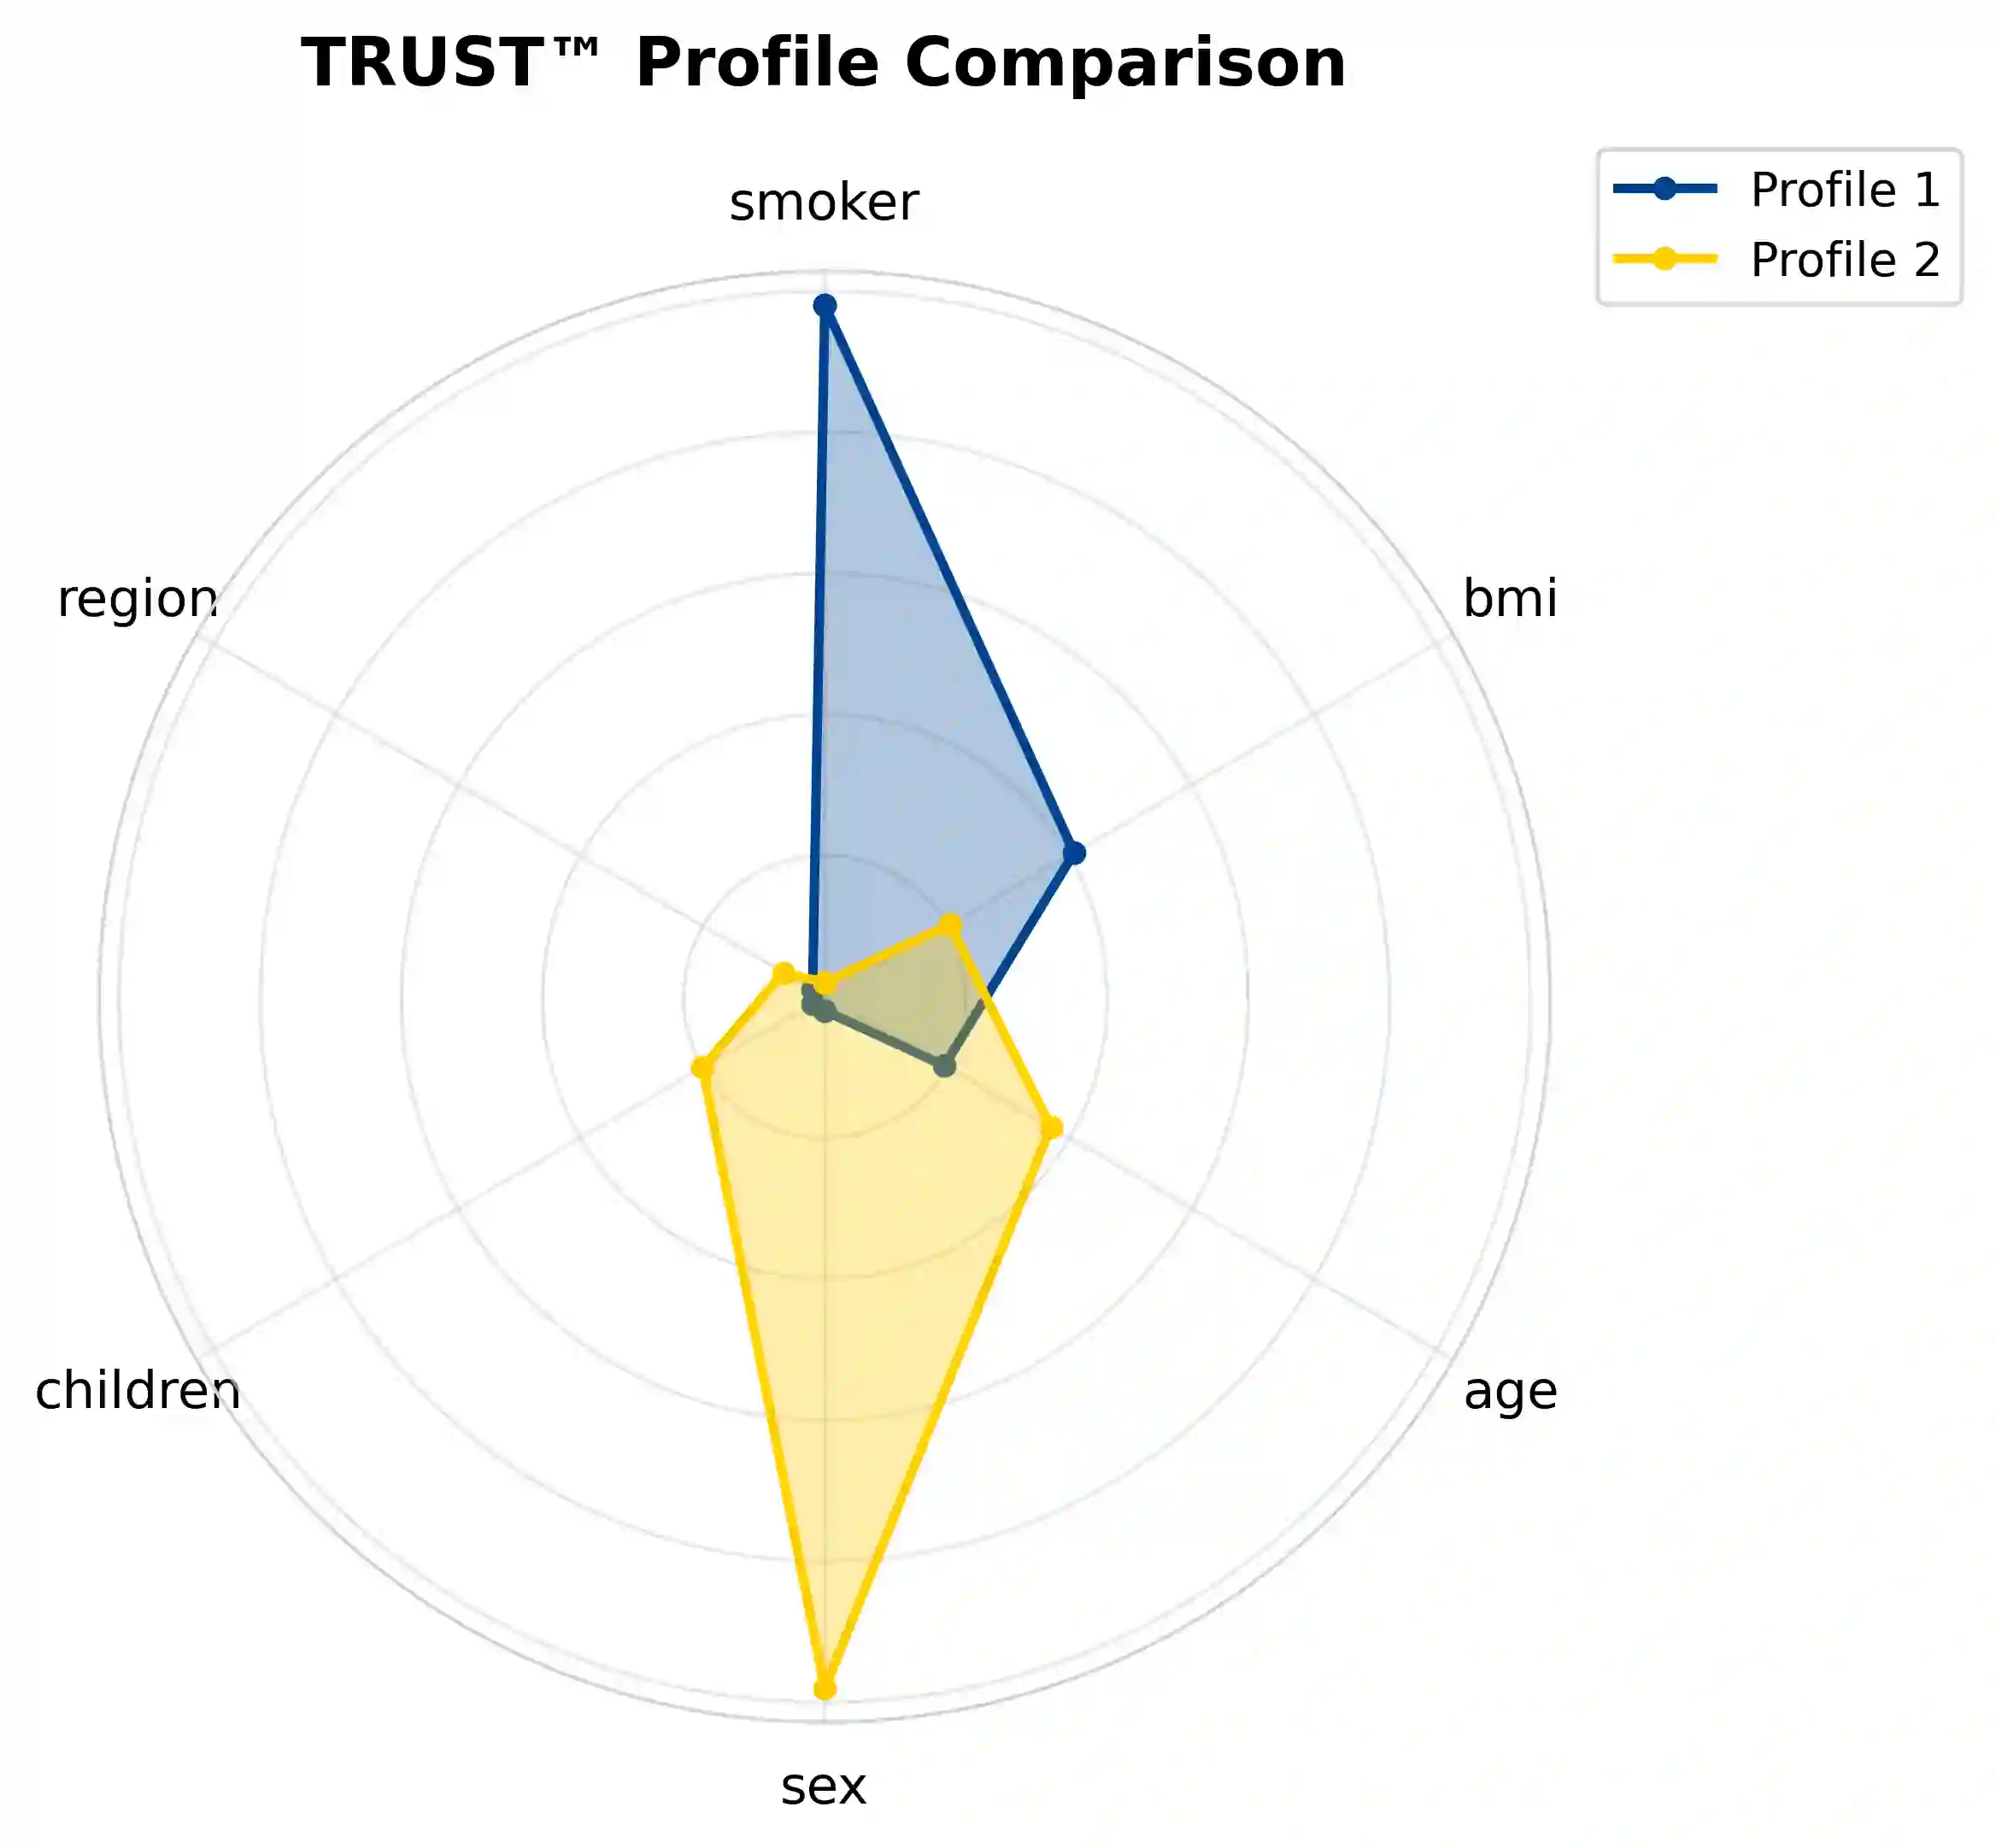
Radar charts are widely used to visualize multivariate data and compare multiple profiles across features. However, the visual clarity of radar charts can be severely compromised when feature values alternate drastically in magnitude around the circle, causing areas to collapse, which misrepresents relative differences. In the present work we introduce a permutation optimization strategy that reorders features to minimize polygon ``spikiness'' across multiple profiles simultaneously. The method is combinatorial (exhaustive search) for moderate numbers of features and uses a lexicographic minimax criterion that first considers overall smoothness (mean jump) and then the largest single jump as a tie-breaker. This preserves more global information and produces visually balanced arrangements. We discuss complexity, practical bounds, and relations to existing approaches that either change the visualization (e.g., OrigamiPlot) or learn orderings (e.g., Versatile Ordering Network). An example with two profiles and $p=6$ features (before/after ordering) illustrates the qualitative improvement. Keywords: data visualization, radar charts, combinatorial optimization, minimax optimization, feature ordering
翻译:雷达图广泛应用于多变量数据可视化及多轮廓特征对比。然而,当特征值在圆周上幅值剧烈交替变化时,会导致多边形区域塌陷,扭曲相对差异关系,从而严重损害雷达图的视觉清晰度。本研究提出一种排列优化策略,通过重新排序特征以同时最小化多个轮廓的多边形"尖刺度"。该方法针对中等数量特征采用组合优化(穷举搜索),并运用字典序极小极大准则:首先考虑整体平滑度(平均跳跃值),再以最大单次跳跃值作为平局决胜依据。此方法能保留更多全局信息,并生成视觉平衡的布局。我们探讨了算法复杂度、实际边界条件,以及与现有方法的关联——现有方法或改变可视化形式(如OrigamiPlot),或学习排序规则(如Versatile Ordering Network)。通过包含两个轮廓和$p=6$个特征的示例(排序前后对比),展示了该方法在视觉质量上的改进效果。关键词:数据可视化,雷达图,组合优化,极小极大优化,特征排序