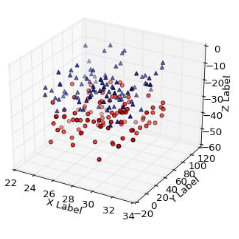
We present MatplotAlt, an open-source Python package for easily adding alternative text to Matplotlib figures. MatplotAlt equips Jupyter notebook authors to automatically generate and surface chart descriptions with a single line of code or command, and supports a range of options that allow users to customize the generation and display of captions based on their preferences and accessibility needs. Our evaluation indicates that MatplotAlt's heuristic and LLM-based methods to generate alt text can create accurate long-form descriptions of both simple univariate and complex Matplotlib figures. We find that state-of-the-art LLMs still struggle with factual errors when describing charts, and improve the accuracy of our descriptions by prompting GPT4-turbo with heuristic-based alt text or data tables parsed from the Matplotlib figure.
翻译:暂无翻译


