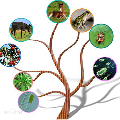
The visualization of 3D point cloud data is essential in fields such as autonomous navigation, environmental monitoring, and disaster response, where tasks like object recognition, structural analysis, and spatiotemporal exploration rely on clear and effective visual representation. Despite advancements in AI-driven processing, visualization remains a critical tool for interpreting complex spatial datasets. However, designing effective point cloud visualizations presents significant challenges due to the sparsity, density variations, and scale of the data. In this work, we analyze the design space of spatial point cloud visualization, highlighting a gap in systematically mapping visualization techniques to analytical objectives. We introduce a taxonomy that categorizes four decades of visualization design choices, linking them to fundamental challenges in modern applications. By structuring visualization strategies based on data types, user objectives, and visualization techniques, our framework provides a foundation for advancing more effective, interpretable, and user-centered visualization techniques.
翻译:暂无翻译


