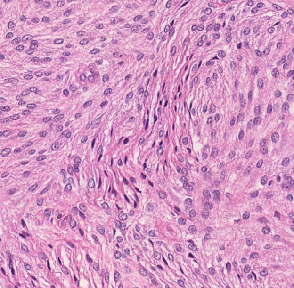
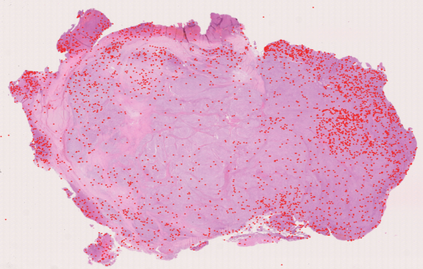
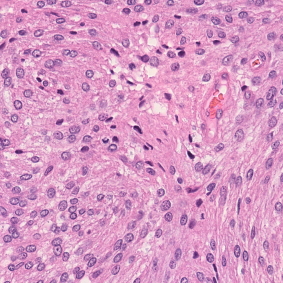
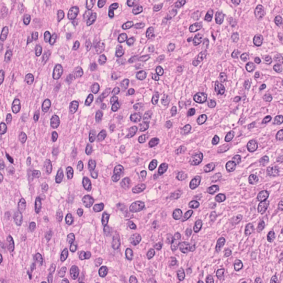
Meningioma is one of the most prevalent brain tumors in adults. To determine its malignancy, it is graded by a pathologist into three grades according to WHO standards. This grade plays a decisive role in treatment, and yet may be subject to inter-rater discordance. In this work, we present and compare three approaches towards fully automatic meningioma grading from histology whole slide images. All approaches are following a two-stage paradigm, where we first identify a region of interest based on the detection of mitotic figures in the slide using a state-of-the-art object detection deep learning network. This region of highest mitotic rate is considered characteristic for biological tumor behavior. In the second stage, we calculate a score corresponding to tumor malignancy based on information contained in this region using three different settings. In a first approach, image patches are sampled from this region and regression is based on morphological features encoded by a ResNet-based network. We compare this to learning a logistic regression from the determined mitotic count, an approach which is easily traceable and explainable. Lastly, we combine both approaches in a single network. We trained the pipeline on 951 slides from 341 patients and evaluated them on a separate set of 141 slides from 43 patients. All approaches yield a high correlation to the WHO grade. The logistic regression and the combined approach had the best results in our experiments, yielding correct predictions in 32 and 33 of all cases, respectively, with the image-based approach only predicting 25 cases correctly. Spearman's correlation was 0.716, 0.792 and 0.790 respectively. It may seem counterintuitive at first that morphological features provided by image patches do not improve model performance. Yet, this mirrors the criteria of the grading scheme, where mitotic count is the only unequivocal parameter.
翻译:脑膜瘤是成年人中最常见的脑肿瘤之一。 为了确定它的恶性, 它被一个病理学家按照世卫组织的标准分为三级。 这个等级在治疗中起着决定性作用, 并且可能受到跨河者之间的不和。 在这项工作中, 我们展示并比较了三种方法, 完全自动地将脑膜瘤从整个幻灯片图象中分级。 所有方法都遵循一个两阶段模式。 我们首先根据一个以ResNet为基础的网络编码的变形特征来确定一个感兴趣的区域。 我们首先通过一个最先进的目标探测深度学习网络在幻灯片中检测线性数字。 这个最高线性反应率区域被认为是生物肿瘤行为的特点。 在第二个阶段, 我们根据这个区域所含的信息用三个不同的环境来计算肿瘤恶性反应的得分数。 在第一个方法中, 图像模型来自这个区域, 图像模型基于一个以ResNet为基础的网络的变形特征。 我们比较了这个方法, 从一个明确的线性统计方法, 一种易于追踪和解释的方法。 最后, 我们把一个直径直的直径直值分别结合了一个直方的直径方的病理病理病理病理病理病理病理病理病理病理病理病理病理病理病理学 。 我们用了一个直径的计算了一个直径的计算方法, 在一个直径的轨法第43了, 。