corrplot包与ggcorrplot相关图(二)

作者:李誉辉
四川大学在读研究生
前文推送:
1.8
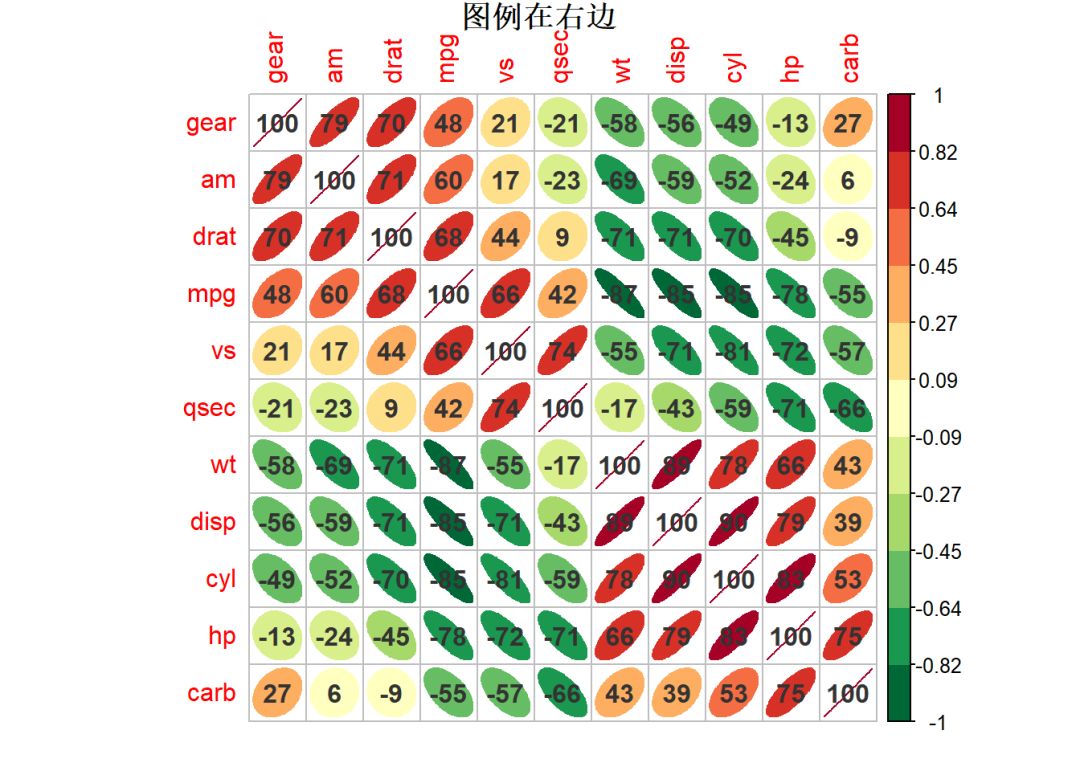
cl.pos图例位置
1corrplot(mat_cor, method = "ellipse", order = "AOE", col = palette_2,
2 addCoef.col = "gray20", addCoefasPercent = TRUE, cl.pos = "r",
3 title = "图例在右边", diag = TRUE, mar = c(1,1,1,1))
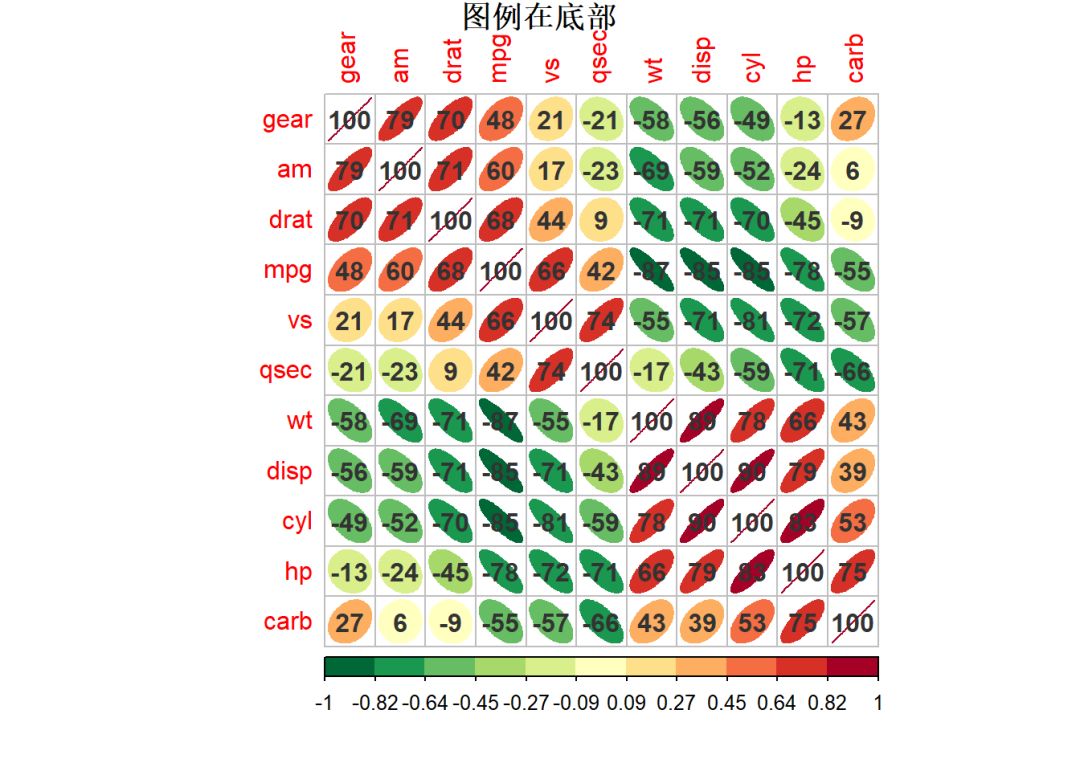
4corrplot(mat_cor, method = "ellipse", order = "AOE", col = palette_2,
5 addCoef.col = "gray20", addCoefasPercent = TRUE, cl.pos = "b",
6 title = "图例在底部", diag = TRUE, mar = c(1,1,1,1))
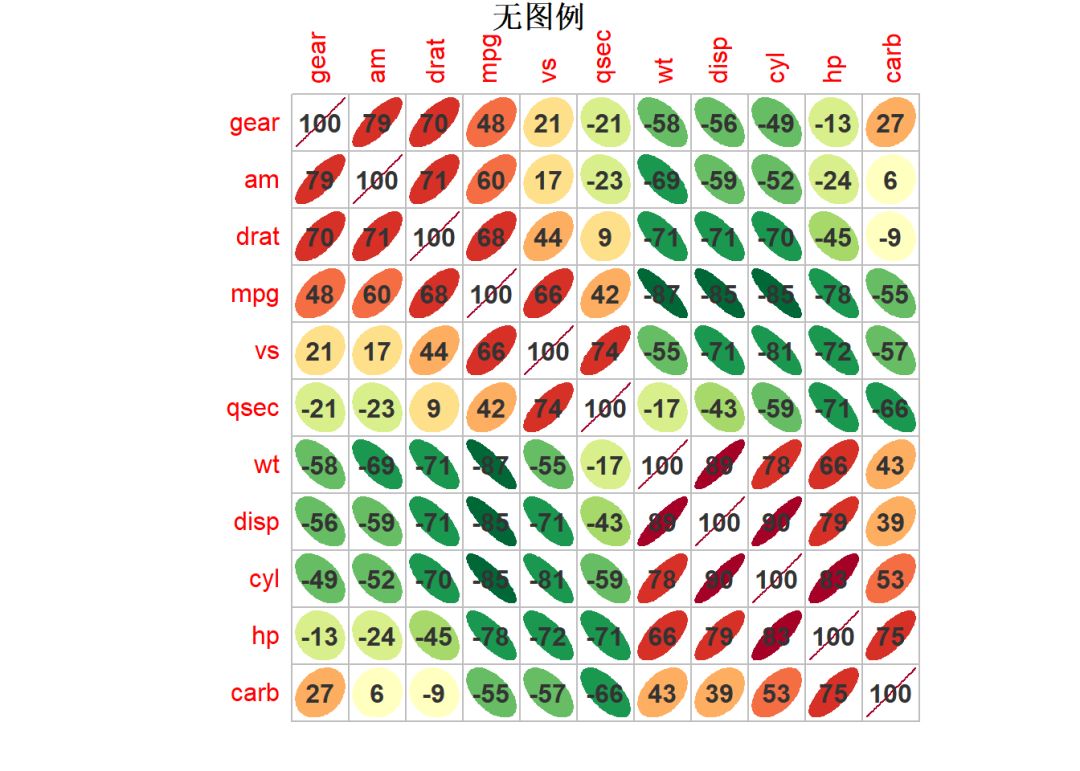
7corrplot(mat_cor, method = "ellipse", order = "AOE", col = palette_2,
8 addCoef.col = "gray20", addCoefasPercent = TRUE, cl.pos = "n",
9 title = "无图例", diag = TRUE, mar = c(1,1,1,1))
1.9
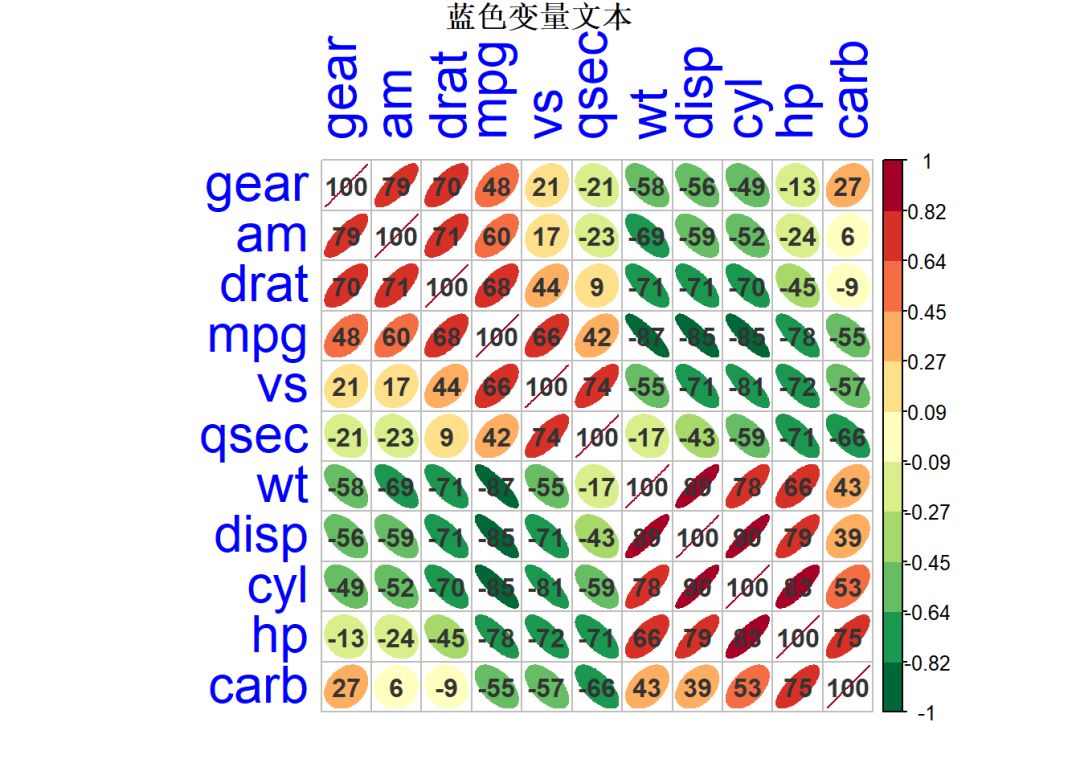
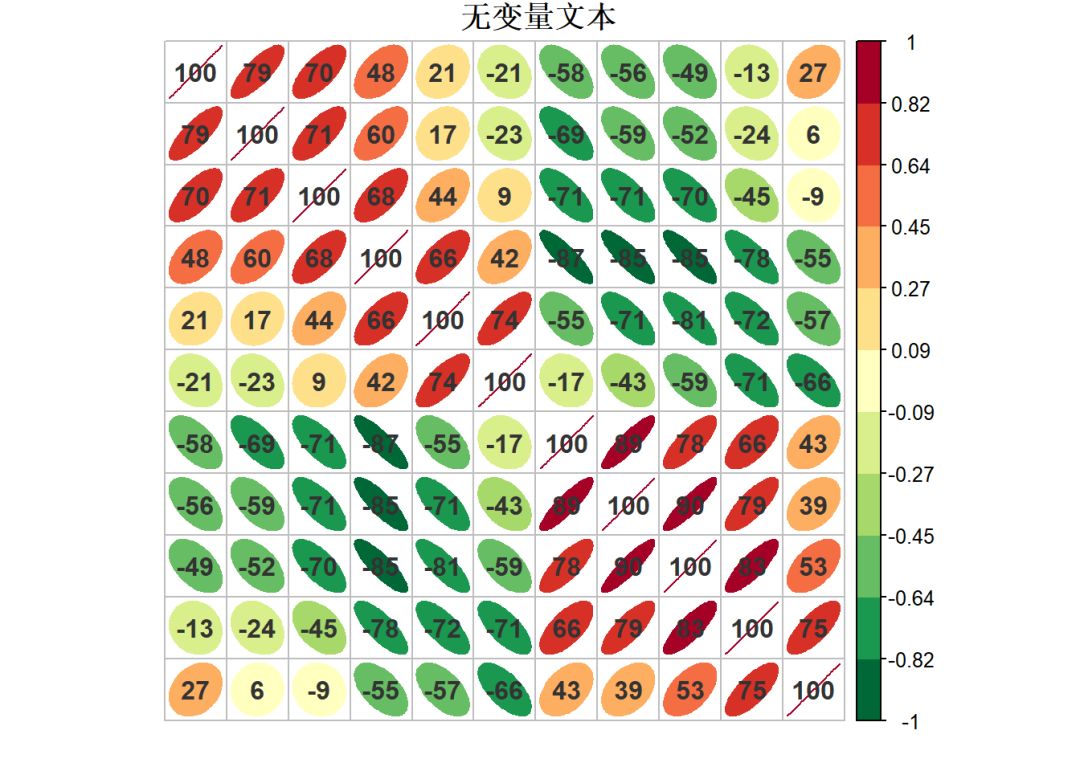
变量文本tl.pos、tl.cex及tl.col
tl.pos只有在混合布局的时候才有意义。
1corrplot(mat_cor, method = "ellipse", order = "AOE",  col = palette_2,
2         addCoef.col = "gray20", addCoefasPercent = TRUE, cl.pos = "r",
3         tl.pos = "lt",tl.cex = 2, tl.col = "blue",
4         title = "蓝色变量文本", diag = TRUE, mar = c(1,1,1,1))
5
6corrplot(mat_cor, method = "ellipse", order = "AOE",  col = palette_2,
7         addCoef.col = "gray20", addCoefasPercent = TRUE, cl.pos = "r",
8         tl.pos = "n",
9         title = "无变量文本", diag = TRUE, mar = c(1,1,1,1))
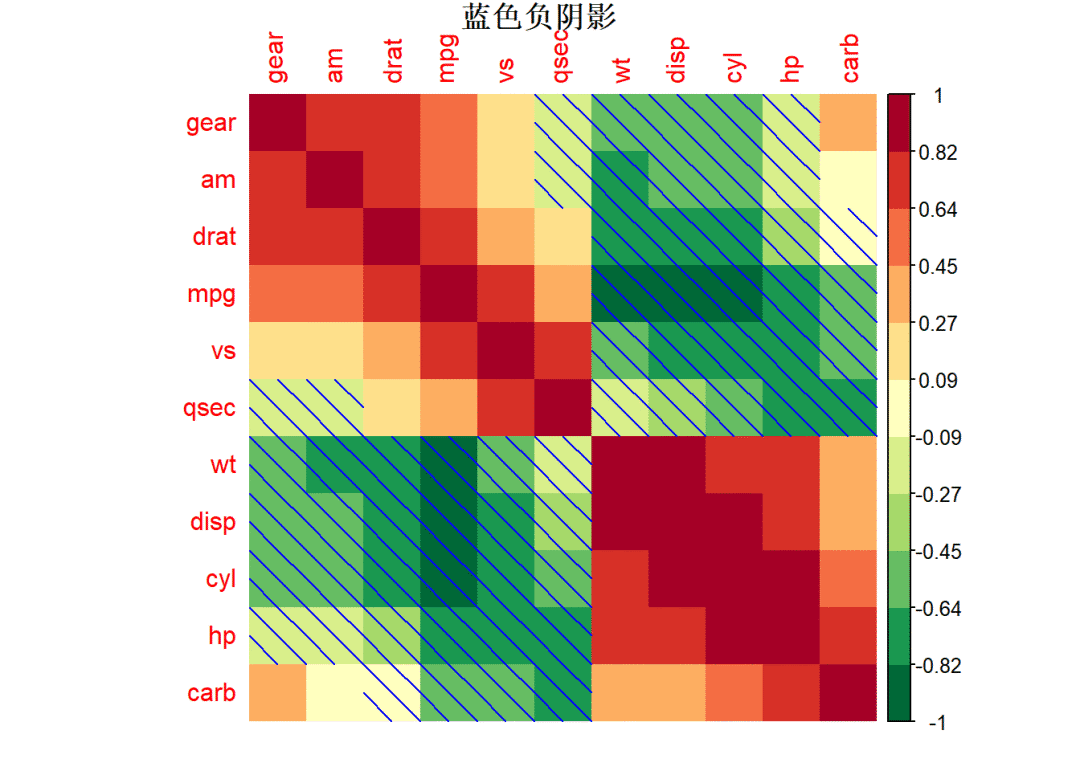
1.10
阴影设置
只有当method="shade"时,该参数才有用。addshade添加阴影范围,分为正阴影,负阴影,全阴影。shade.lwd设置阴影线宽。shade.col设置阴影线颜色。
1corrplot(mat_cor, method = "shade", order = "AOE", col = palette_2,
2 addshade = "negative", shade.lwd = 1, shade.col = "blue",
3 title = "蓝色负阴影", mar = c(1,1,1,1))
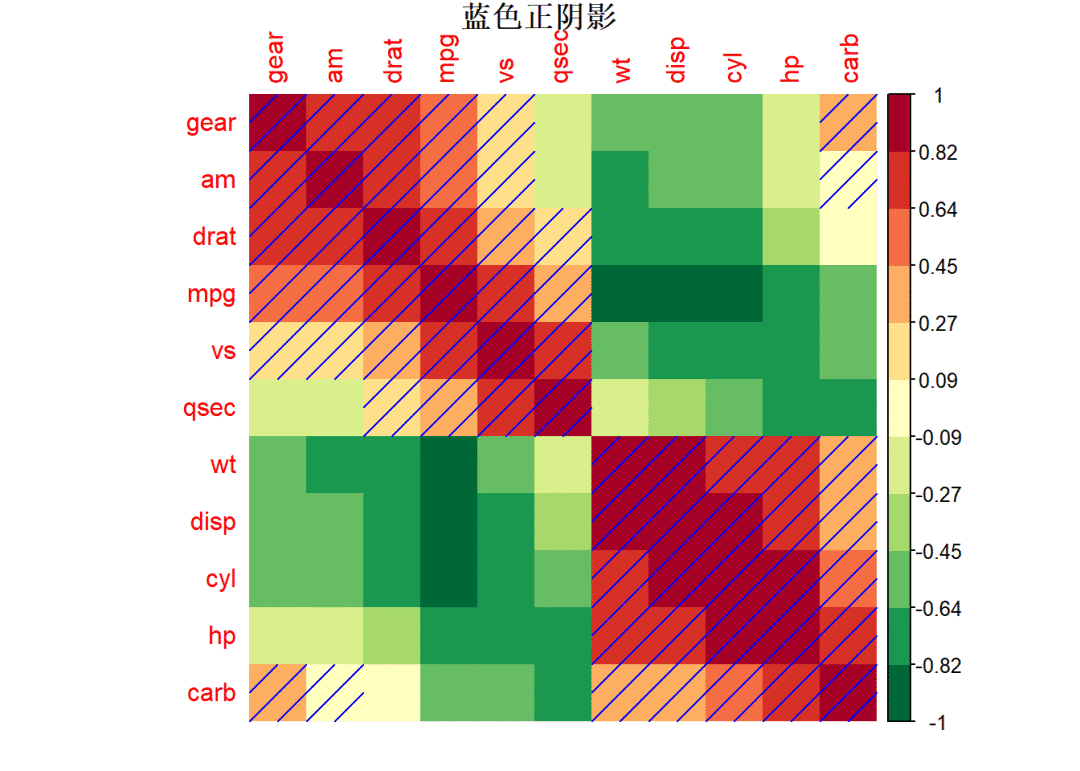
4corrplot(mat_cor, method = "shade", order = "AOE", col = palette_2,
5 addshade = "positive", shade.lwd = 1, shade.col = "blue",
6 title = "蓝色正阴影", mar = c(1,1,1,1))
7corrplot(mat_cor, method = "shade", order = "AOE", col = palette_2,
8 shade.lwd = 1, shade.col = "blue",
9 title = "默认全阴影", mar = c(1,1,1,1))

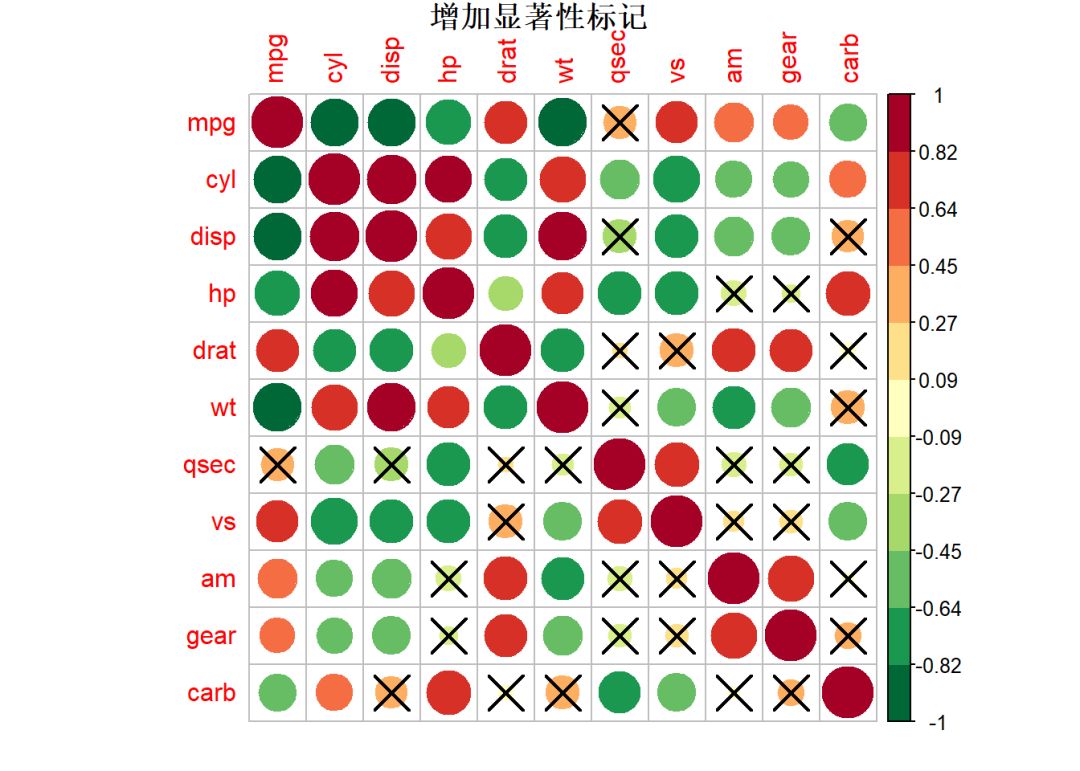
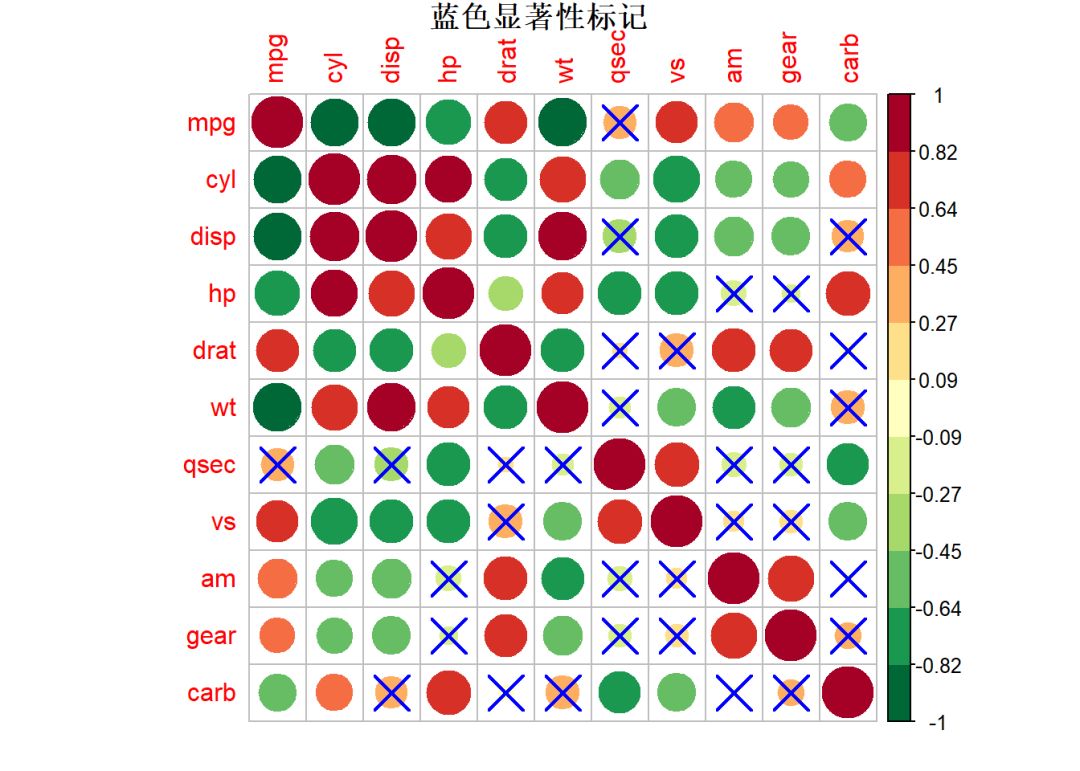
1.11
显著性标记sig.level及p.mat
只有指定矩阵的P值,sig.level,pch等参数才有效。
只有当insig = "pch"时,pch.col和pch.cex参数才有效。
对于p值不清楚的同学,可以参考 知乎的答案
(https://www.zhihu.com/question/23149768)
概况起来,就一句话:小于p值的不可能信,没有意义。
 1library(corrplot)
 2
 3res1 <- cor.mtest(mtcars, conf.level = .95)
 4
 5corrplot(mat_cor, method = "circle",  col = palette_2,
 6         p.mat = res1$p, sig.level = 0.01,
 7         title = "增加显著性标记", mar = c(1,1,1,1))
 8
 9corrplot(mat_cor, method = "circle",  col = palette_2,
10         p.mat = res1$p, sig.level = 0.01, insig = "pch", pch.col = "blue", pch.cex = 3,
11         title = "蓝色显著性标记", mar = c(1,1,1,1))
12
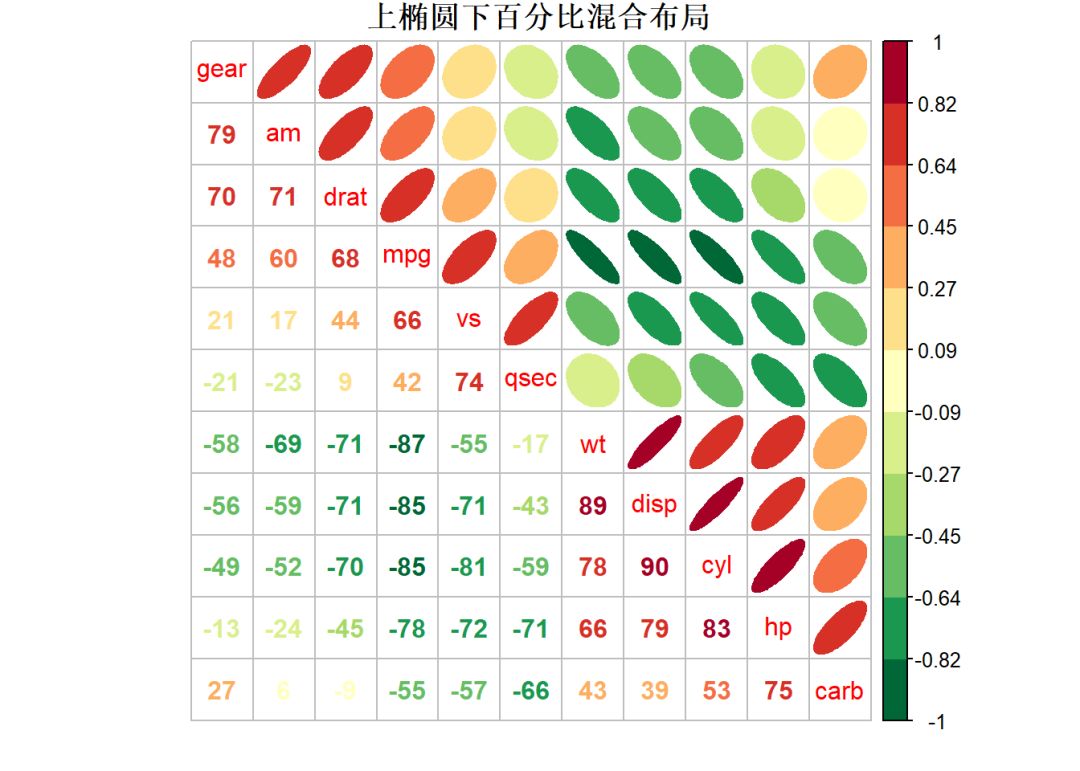
1.12
add混合布局
add参数表示是否添加到已经存在的plot中。默认FALSE生成新plot。
1# 第一个图,
2corrplot(mat_cor, method = "ellipse", type = "upper", order = "AOE",
3 col = palette_2, tl.pos = "d",
4 title = "上椭圆下百分比混合布局", mar = c(1,1,1,1))
5corrplot(mat_cor, method = "number", type = "lower", order = "AOE", col = palette_2,
6 add = TRUE, diag = FALSE, tl.pos = "n", addCoefasPercent = TRUE, cl.pos = "n",
7 mar = c(1,1,1,1))
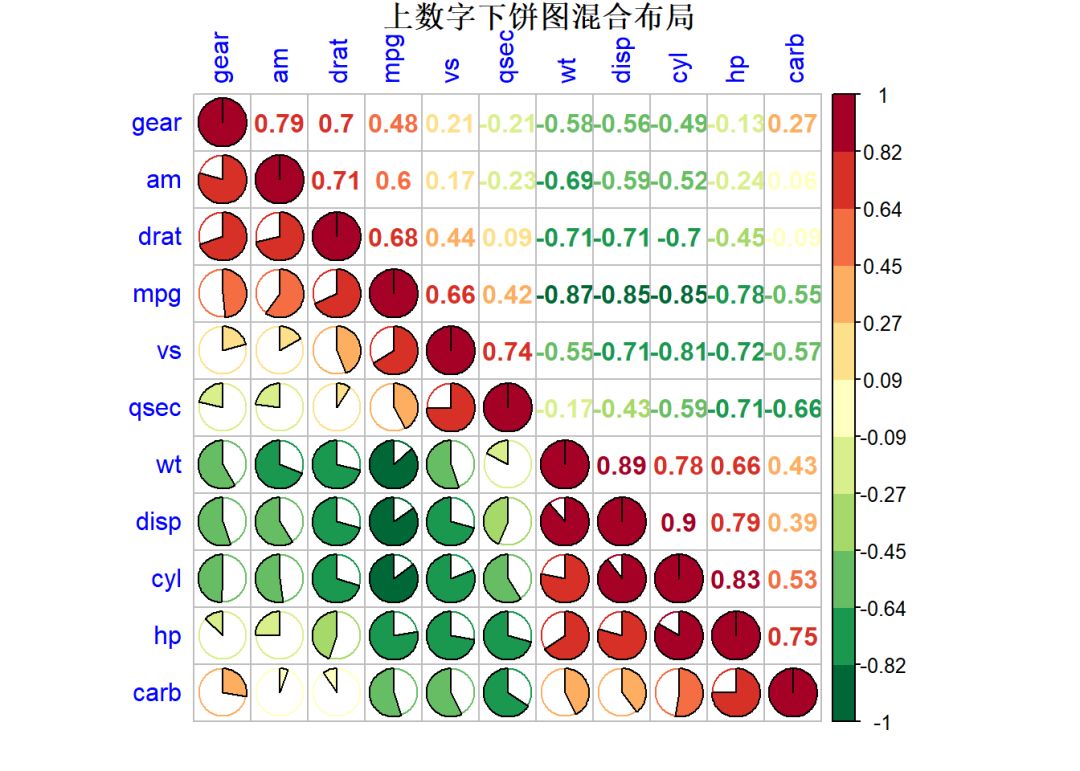
8# 第2个图,
9corrplot(mat_cor, method = "pie", type = "lower", order = "AOE",
10 col = palette_2, tl.pos = "tp", tl.col = "blue", cl.pos = "r",
11 title = "上数字下饼图混合布局", mar = c(1,1,1,1))
12corrplot(mat_cor, method = "number", type = "upper", order = "AOE", col = palette_2,
13 add = TRUE, diag = FALSE, tl.pos = "n", cl.pos = "n",
14 mar = c(1,1,1,1))
ggcorrplot包内就2个函数,一个cor_pmat()用于计算p值, 一个ggcorrplot()用于绘图。
ggcorrplot相当于精简版的corrplot包。只有主题更加丰富多样。
2.1
语法及参数
语法:
1ggcorrplot(corr, method = c("square", "circle"), type = c("full", "lower",
2  "upper"), ggtheme = ggplot2::theme_minimal, title = "",
3  show.legend = TRUE, legend.title = "Corr", show.diag = FALSE,
4  colors = c("blue", "white", "red"), outline.color = "gray",
5  hc.order = FALSE, hc.method = "complete", lab = FALSE,
6  lab_col = "black", lab_size = 4, p.mat = NULL, sig.level = 0.05,
7  insig = c("pch", "blank"), pch = 4, pch.col = "black", pch.cex = 5,
8  tl.cex = 12, tl.col = "black", tl.srt = 45, digits = 2)
关键参数:
method,相比corrplot,少了很多种,只有方形和圆形,默认方形。colors,需要长度为3的颜色向量,同时指定low,mid和high处的颜色。outline.color,指定方形或圆形的边线颜色。hc.order,是否按hclust(层次聚类顺序)排列。hc.method,相当于corrplot中的hclust.method, 指定方法一样,详情见?hclust。lab, 是否添加相关系数。lab_col,指定相关系数的颜色,只有当lab=TRUE时有效。lab_size,指定相关系数大小,只有当lab=TRUE时有效。show.legend, 是否显示图例。legend.title,指定图例标题。sig.level,insig,pch,pch.col,pch.cex,与corrplot中完全一样。tl.cex, 指定变量文本的大小,tl.col, 指定变量文本的颜色,tl.srt, 指定变量文本的旋转角度。digits, 指定相关系数的显示小数位数(默认2)。
2.2
实例
1library(ggplot2)
2library(ggcorrplot)
3library(showtext)
4
5# 更改字体
6windowsFonts(YaHei_rontine = windowsFont("微软雅黑"),
7 Time_NewR = windowsFont("Times New Romans 常规"))
8font_add("YaHei_rontine", regular = "msyh.ttc", bold = "msyhbd.ttc")
9font_add("Time_NewR", "times.ttf",
10 bold = "timesbd.ttf",
11 italic = "timesi.ttf",
12 bolditalic = "timesbd.ttf")
13
14showtext_auto()
15
16# 自定义主题
17mytheme <- theme_bw() +
18 theme(
19 plot.title = element_text(colour = "blue", hjust = 0.5, size = 20),
20 legend.text = element_text(colour = "blue"),
21 legend.title = element_text(family = "YaHei_rontine", colour = "blue"),
22 legend.position = "bottom", legend.direction = "horizontal"
23 )
24
25
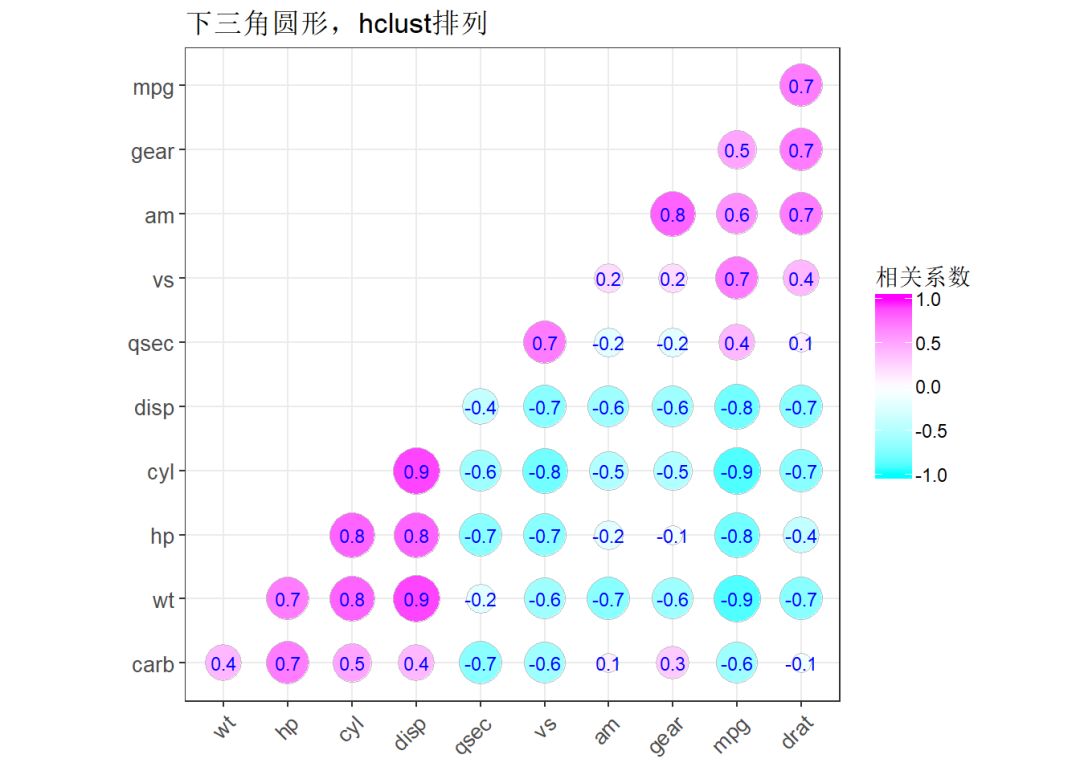
26# 绘图
27ggcorrplot(mat_cor,
28 method="circle",
29 hc.order = TRUE,
30 type = "lower",
31 lab = TRUE, # 显示相关系数
32 lab_col = "blue", lab_size = 3,
33 colors = c("cyan", "white", "magenta"),
34 tl.cex = 10, tl.col = "blue", digits = 1,
35 title="下三角圆形,hclust排列",
36 legend.title = "相关系数",
37 ggtheme = theme_bw())
38
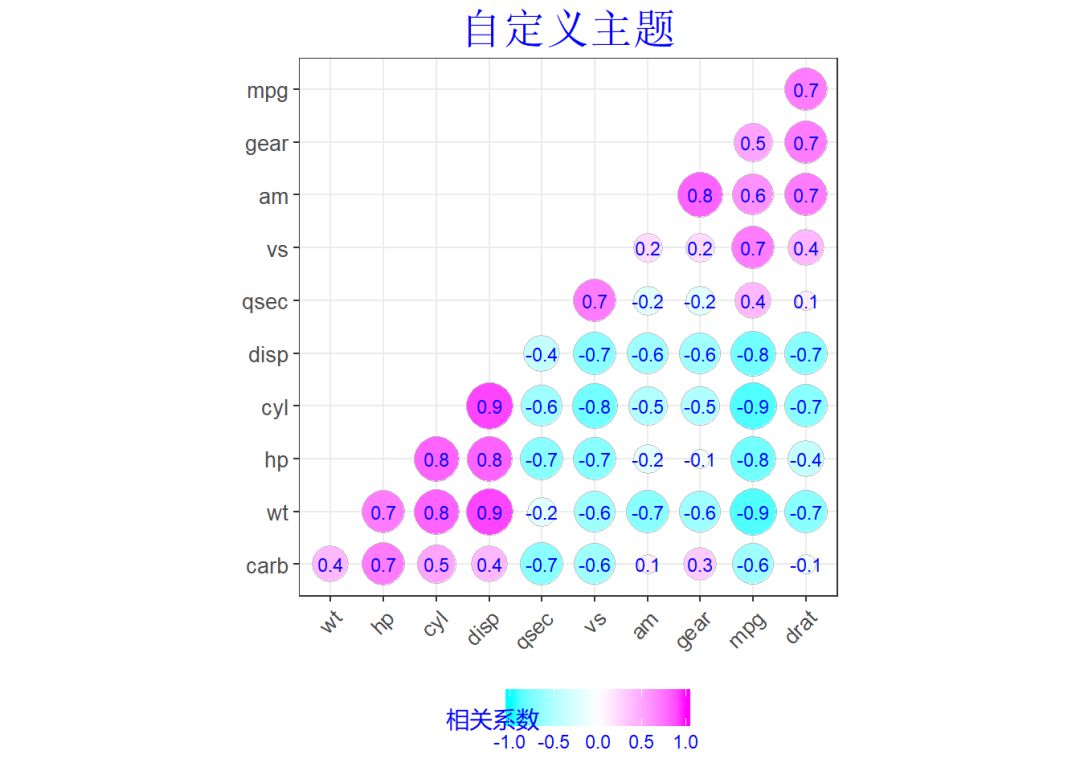
39# 自定义主题
40ggcorrplot(mat_cor,
41 method="circle",
42 hc.order = TRUE,
43 type = "lower",
44 lab = TRUE, # 显示相关系数
45 lab_col = "blue", lab_size = 3,
46 colors = c("cyan", "white", "magenta"),
47 tl.cex = 10, tl.col = "blue", digits = 1,
48 title="自定义主题",
49 legend.title = "相关系数",
50 ggtheme = mytheme)
2.3
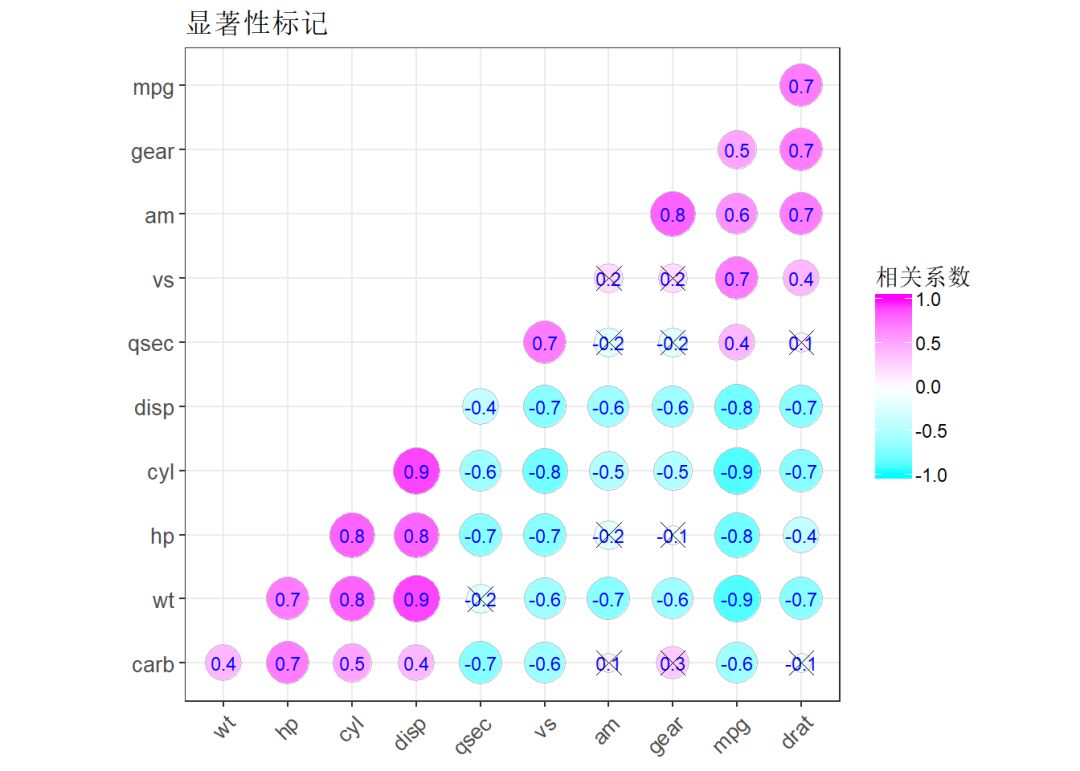
显著性标记
1library(ggplot2)
2library(ggcorrplot)
3
4p_mat <- cor_pmat(mtcars)
5
6ggcorrplot(mat_cor,
7 method="circle", hc.order = TRUE, type = "lower",
8 lab = TRUE, lab_col = "blue", lab_size = 3, # 显示相关系数
9 colors = c("cyan", "white", "magenta"),
10 tl.cex = 10, tl.col = "blue", digits = 1,
11 title="显著性标记",
12 legend.title = "相关系数",
13 p.mat = p_mat,
14 ggtheme = theme_bw())
15
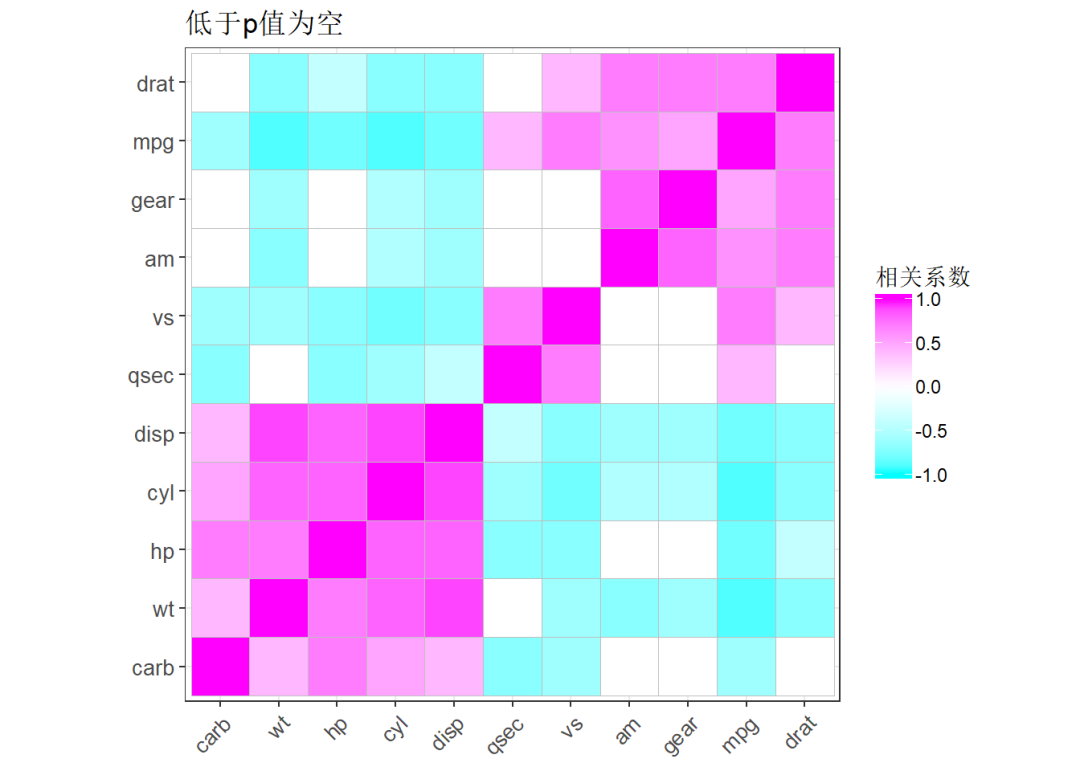
16ggcorrplot(mat_cor,
17 hc.order = TRUE, type = "full",
18 colors = c("cyan", "white", "magenta"),
19 tl.cex = 10, tl.col = "blue", digits = 1,
20 title="低于p值为空",
21 legend.title = "相关系数",
22 p.mat = p_mat, insig = "blank",
23 ggtheme = theme_bw())
24
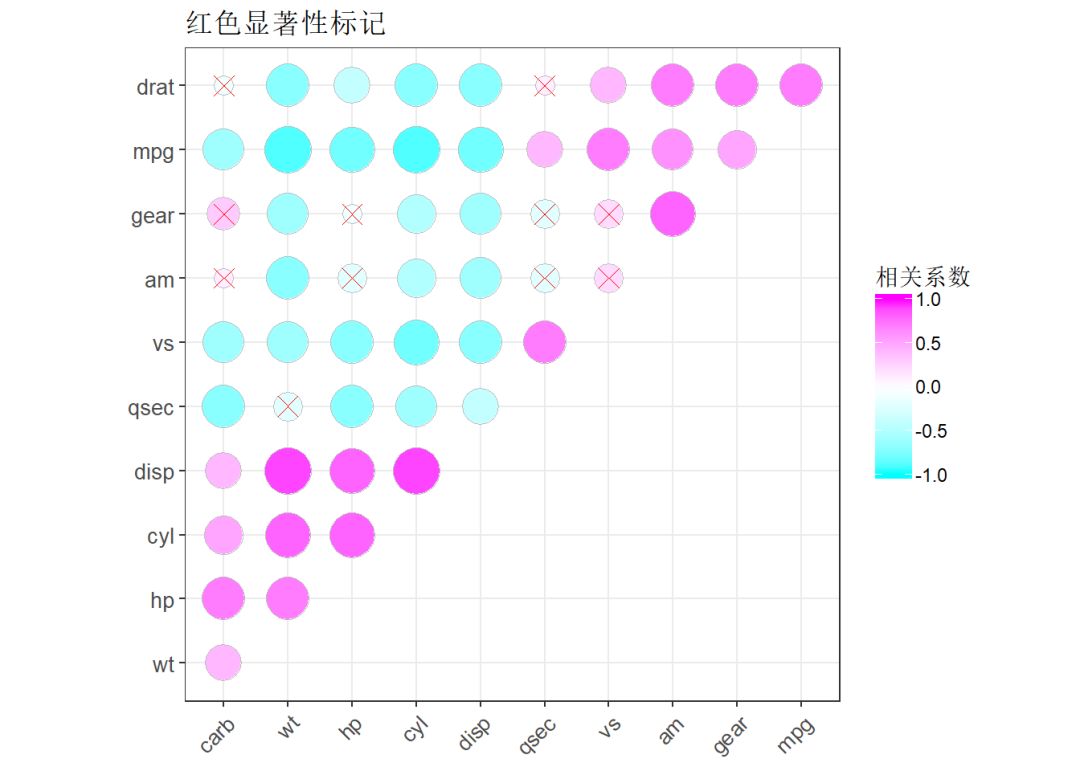
25ggcorrplot(mat_cor,
26 method="circle", hc.order = TRUE, type = "upper",
27 colors = c("cyan", "white", "magenta"),
28 tl.cex = 10, tl.col = "blue", digits = 1,
29 title="红色显著性标记",
30 legend.title = "相关系数",
31 p.mat = p_mat, insig = "pch", pch.col = "red", pch.cex = 4,
32 ggtheme = theme_bw())
33
参
考资料
使用corrplot包绘制相关性图
https://www.jianshu.com/p/00000f6f32df
R画月亮阴晴圆缺:corrplot绘图相关系数矩阵
https://blog.csdn.net/woodcorpse/article/details/79417978
ggcorrplot: Visualization of a correlation matrix using ggplot2
http://www.sthda.com/english/wiki/ggcorrplot-visualization-of-a-correlation-matrix-using-ggplot2
R语言相关系数可视化之corrplot包
https://zhuanlan.zhihu.com/p/28076189
R语言相关关系可视化函数梳理
https://zhuanlan.zhihu.com/p/36925332
https://mp.weixin.qq.com/s/Nm9NEGG9gy-lEX34kyxFgQ?token=867568924&lang=zh_CN
ggplot2最顶级的50种可视化图
http://r-statistics.co/Top50-Ggplot2-Visualizations-MasterList-R-Code.html
DT包用法
https://rstudio.github.io/DT/
——————————————
往期精彩: