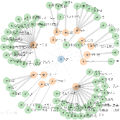
Climate science has become more ambitious in recent years as global awareness about the environment has grown. To better understand climate, historical climate (e.g. archived meteorological variables such as temperature, wind, water, etc.) and climate-related data (e.g. geographical features and human activities) are widely used by today's climate research to derive models for an explainable climate change and its effects. However, such data sources are often dispersed across a multitude of disconnected data silos on the Web. Moreover, there is a lack of advanced climate data platforms to enable multi-source heterogeneous climate data analysis, therefore, researchers must face a stern challenge in collecting and analyzing multi-source data. In this paper, we address this problem by proposing a climate knowledge graph for the integration of multiple climate data and other data sources into one service, leveraging Web technologies (e.g. HTTP) for multi-source climate data analysis. The proposed knowledge graph is primarily composed of data from the National Oceanic and Atmospheric Administration's daily climate summaries, OpenStreetMap, and Wikidata, and it supports joint data queries on these widely used databases. This paper shows, with a use case in Ireland and the United Kingdom, how climate researchers could benefit from this platform as it allows them to easily integrate datasets from different domains and geographical locations.
翻译:近年来,随着全球环境意识的提高,气候科学变得更为雄心勃勃。为了更好地了解气候、历史气候(例如温度、风、水等存档气象变量)和气候相关数据(例如地理特征和人类活动),今天的气候研究广泛使用了历史气候(例如温度、风、水等存档气象变量)和气候相关数据(例如地理特征和人类活动),以得出可解释气候变化及其影响的模型。然而,这类数据源往往分散在网络上许多互不相连的数据库中。此外,由于缺乏先进的气候数据平台,无法进行多种来源的气候数据分析,因此,研究人员在收集和分析多来源数据时必须面临严峻的挑战。在本文件中,我们通过提出气候知识图表,将多种气候数据和其他数据来源纳入一项服务,利用网络技术(例如HTTP)进行多来源气候数据分析,来解决这一问题。拟议的知识源图主要由国家海洋和大气管理局每日气候摘要、OpenStreetMap和Wikidata的数据组成,支持这些广泛使用的数据库的联合数据查询。本文通过提出气候知识图表,提出气候知识图可以轻易地让研究人员从爱尔兰和英国获得数据。


