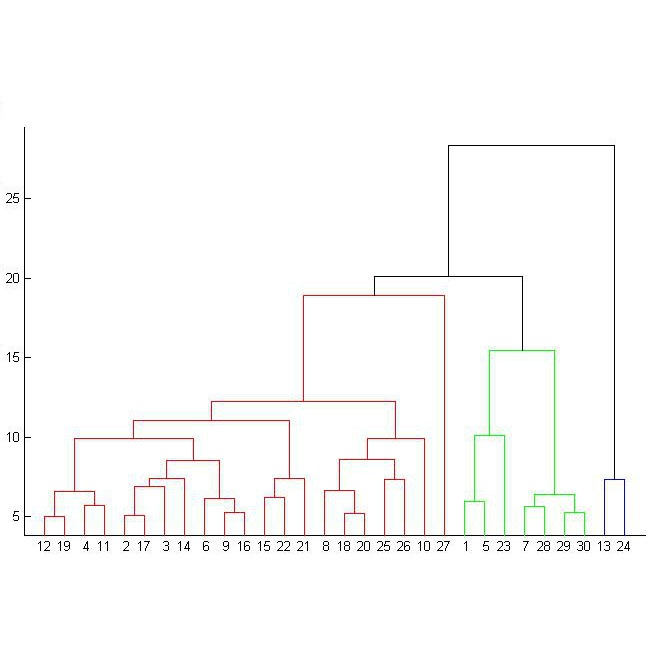
In this paper, we study the connection between the companies in the Swedish capital market. We consider 28 companies included in the determination of the market index OMX30. The network structure of the market is constructed using different methods to determine the distance between the companies. We use hierarchical clustering methods to find the relation among the companies in each window. Next, we obtain one-dimensional time series of the distances between the clustering trees that reflect the changes in the relationship between the companies in the market over time. The method of statistical process control, namely the Shewhart control chart, is applied to those time series to detect abnormal changes in the financial market.
翻译:在本文中,我们研究了瑞典资本市场各公司之间的联系。我们认为,在确定市场指数OMX30中包括了28家公司。市场网络结构的构建使用了不同的方法来确定公司之间的距离。我们使用等级分组方法寻找每个窗口中各公司之间的关系。接着,我们获得了反映各公司在市场关系随时间变化的集群树之间的距离的一维时间序列。统计过程控制方法,即谢沃特控制图,适用于这些时间序列,以探测金融市场的异常变化。


