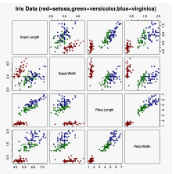
This paper extends an existing visualization, the Parallel Coordinates Plot (PCP), specifically its polar coordinate representation, the $\textit{Polar Parallel Coordinates Plot (P2CP)}$. With the additional incorporation of techniques borrowed from Hive Plot network visualizations, we demonstrate improved capabilities to explore multidimensional data in flatland, with a particular emphasis on the unique ability to represent 3-dimensional data. To demonstrate these techniques on P2CPs, we consider toy data, the Iris dataset, and socioeconomic data for counties in the United States. We conclude with an exploration of Covid-19 data from counties in the contiguous United States.
翻译:本文扩展了现有的可视化,即平行坐标图(PCP),特别是其极地协调代表,即$\textit{Polar平行坐标图(P2CP)$。随着从蜂窝绘图网网络图(P2CP)图(P2CP)中借用的技术的进一步整合,我们展示了在平地探索多维数据的能力,特别强调了代表三维数据的独特能力。为了展示P2CP的这些技术,我们认为美国各州的数据、Iris数据集和社会经济数据。我们最后探索了美国毗连州的Covid-19州的数据。
相关内容
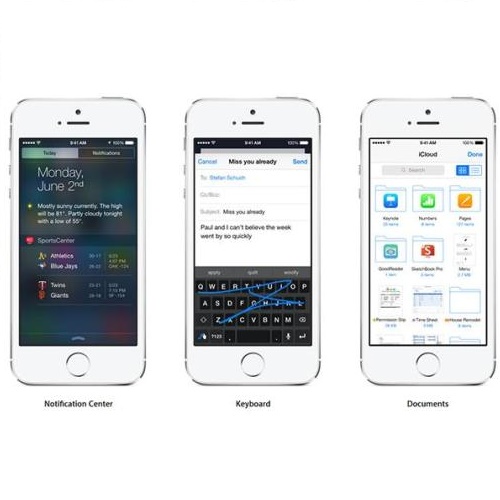
- Today (iOS and OS X): widgets for the Today view of Notification Center
- Share (iOS and OS X): post content to web services or share content with others
- Actions (iOS and OS X): app extensions to view or manipulate inside another app
- Photo Editing (iOS): edit a photo or video in Apple's Photos app with extensions from a third-party apps
- Finder Sync (OS X): remote file storage in the Finder with support for Finder content annotation
- Storage Provider (iOS): an interface between files inside an app and other apps on a user's device
- Custom Keyboard (iOS): system-wide alternative keyboards
Source: iOS 8 Extensions: Apple’s Plan for a Powerful App Ecosystem


