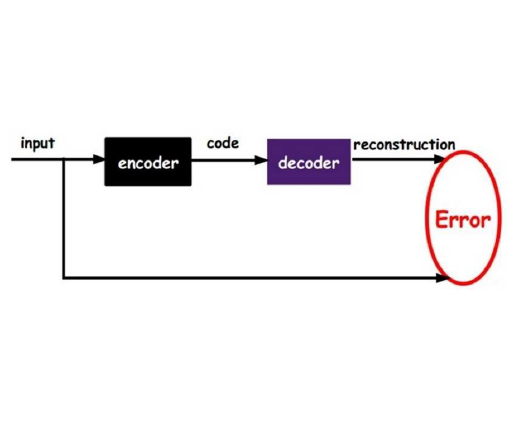
In data systems, activities or events are continuously collected in the field to trace their proper executions. Logging, which means recording sequences of events, can be used for analyzing system failures and malfunctions, and identifying the causes and locations of such issues. In our research we focus on creating an Anomaly detection models for system logs. The task of anomaly detection is identifying unexpected events in dataset, which differ from the normal behavior. Anomaly detection models also assist in data systems analysis tasks. Modern systems may produce such a large amount of events monitoring every individual event is not feasible. In such cases, the events are often aggregated over a fixed period of time, reporting the number of times every event has occurred in that time period. This aggregation facilitates scaling, but requires a different approach for anomaly detection. In this research, we present a thorough analysis of the aggregated data and the relationships between aggregated events. Based on the initial phase of our research we present graphs representations of our aggregated dataset, which represent the different relationships between aggregated instances in the same context. Using the graph representation, we propose Multiple-graphs autoencoder MGAE, a novel convolutional graphs-autoencoder model which exploits the relationships of the aggregated instances in our unique dataset. MGAE outperforms standard graph-autoencoder models and the different experiments. With our novel MGAE we present 60% decrease in reconstruction error in comparison to standard graph autoencoder, which is expressed in reconstructing high-degree relationships.
翻译:数据系统、 活动或事件持续收集, 以追踪其正确的执行。 记录, 即记录事件序列, 可用于分析系统故障和故障, 并查明这些问题的原因和地点。 我们的研究重点是为系统日志创建异常检测模型。 异常检测的任务是查明数据集中与正常行为不同的意外事件。 异常检测模型还有助于数据系统分析任务。 现代系统可能生成大量事件, 监测每个事件, 并不可行。 在这种情况下, 事件通常在固定的时间内汇总, 汇报每个事件在那个时期发生的次数。 这种汇总有助于缩放, 但需要不同的异常检测方法。 在这次研究中, 我们对汇总数据和汇总事件之间的关系进行了透彻分析。 根据我们研究的初始阶段, 我们展示了我们汇总数据集的图示, 它代表了同一背景下的汇总实例之间的不同关系。 使用图表显示, 我们提议多幅图解的自动解剖 MAGAE, 在一个新型的图表中, 一个新型的图形模型, 一个新型的图像模型, 以及一个新型的GAARC 模型中, 一个新型的图表模型, 一个新的的图形模型, 将我们图表中, 的图表的图表中, 的图表中, 的图表中, 的图表中, 的图表中, 的图表中, 将浏览的图表中, 的图表中, 的图表中, 的图表中, 的图表中, 图表中的图表中的图表中的图表中, 的图表中的图表中的图表中, 的模型中, 。


