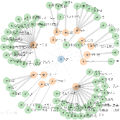
With the fact that the knowledge in each field in university is keeping increasing, the number of university courses is becoming larger, and the content and curriculum system is becoming much more complicated than it used to be, which bring many inconveniences to the course arrangement and analysis. In this paper, we aim to construct a method to visualize all courses based on Google Knowledge Graph. By analysing the properties of the courses and their preceding requirements, we want to extract the relationship between the precursors and the successors, so as to build the knowledge graph of the curriculum system. Using the graph database Neo4j [7] as the core aspect for data storage and display for our new curriculum system will be our approach to implement our knowledge graph. Based on this graph, the venation relationship between courses can be clearly analysed, and some difficult information can be obtained, which can help to combine the outline of courses and the need to quickly query the venation information of courses.
翻译:随着大学各领域知识不断增长,大学课程数量不断增加,大学课程数量不断增加,课程内容和课程系统比过去复杂得多,给课程安排和分析带来许多不便。在本文件中,我们的目标是根据谷歌知识图构建一种方法,对所有课程进行直观分析。通过分析课程的特性及其先前的要求,我们想提取先质与继任者之间的关系,以建立课程系统的知识图。我们的新课程系统的数据储存和显示核心部分是利用图表数据库Neo4j [7]。根据这个图,可以清晰分析课程之间的动画关系,并获得一些困难的信息,这有助于将课程大纲与快速查询课程内容的需要结合起来。


