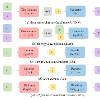
Creating stylized visualization requires going beyond the limited, abstract, geometric marks produced by most tools. Rather, the designer builds stylized idioms where the marks are both transformed (e.g., photographs of candles instead of bars) and also synthesized into a 'scene' that pushes the boundaries of traditional visualizations. To support this, we introduce viz2viz, a system for transforming visualizations with a textual prompt to a stylized form. The system follows a high-level recipe that leverages various generative methods to produce new visualizations that retain the properties of the original dataset. While the base recipe is consistent across many visualization types, we demonstrate how it can be specifically adapted to the creation of different visualization types (bar charts, area charts, pie charts, and network visualizations). Our approach introduces techniques for using different prompts for different marks (i.e., each bar can be something completely different) while still retaining image "coherence." We conclude with an evaluation of the approach and discussion on extensions and limitations.
翻译:创建样式化可视化需要超越大多数工具产生的有限,抽象的几何标记。相反,设计师建立了样式化成语,其中标记被转换(例如,蜡烛的照片代替条形图),并且合成到“场景”中,推动传统可视化的边界。为了支持这一点,我们介绍了viz2viz,一个将文本提示的可视化转换为样式化形式的系统。该系统遵循一个高层食谱,利用各种生成方法来生成保留原始数据集属性的新可视化。虽然基本食谱在许多可视化类型中是一致的,但我们展示了如何具体适应于不同的可视化类型(条形图、面积图、饼图和网络可视化)来创建它。我们的方法引入了使用不同提示的不同标记的技术(即,每个条可以是完全不同的东西),同时保持图像“连贯性”。最后,我们对该方法进行评估,并对扩展和限制进行讨论。


