Data analysis in high-dimensional spaces aims at obtaining a synthetic description of a data set, revealing its main structure and its salient features. We here introduce an approach providing this description in the form of a topography of the data, namely a human-readable chart of the probability density from which the data are harvested. The approach is based on an unsupervised extension of Density Peak clustering and a non-parametric density estimator that measures the probability density in the manifold containing the data. This allows finding automatically the number and the height of the peaks of the probability density, and the depth of the "valleys" separating them. Importantly, the density estimator provides a measure of the error, which allows distinguishing genuine density peaks from density fluctuations due to finite sampling. The approach thus provides robust and visual information about the density peaks' height, their statistical reliability, and their hierarchical organization, offering a conceptually powerful extension of the standard clustering partitions. We show that this framework is particularly useful in the analysis of complex data sets.
翻译:高维空间的数据分析旨在获得对数据集的合成描述,揭示其主结构和突出特征。 我们在此采用一种方法,以数据地形的形式提供这种描述,即用于采集数据的概率密度的人类可读图表,该方法基于一个不受监督的Density Peak群集延伸,以及一个测量含有数据的方块的概率密度的非参数密度估计仪。这可以自动找到概率密度峰值的数量和高度,以及将其分离的“valleys”深度。重要的是,密度估计器提供了一种误差的量度,可以区分因抽样有限而导致的密度波动的真正密度峰值和密度峰值。因此,该方法提供了有关密度峰值、其统计可靠性及其等级结构的可靠和直观信息,提供了标准组群分区在概念上强大的扩展。我们表明,这个框架在复杂数据集的分析中特别有用。
相关内容
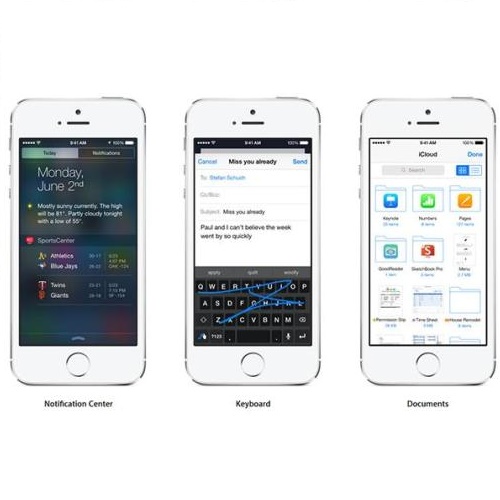
- Today (iOS and OS X): widgets for the Today view of Notification Center
- Share (iOS and OS X): post content to web services or share content with others
- Actions (iOS and OS X): app extensions to view or manipulate inside another app
- Photo Editing (iOS): edit a photo or video in Apple's Photos app with extensions from a third-party apps
- Finder Sync (OS X): remote file storage in the Finder with support for Finder content annotation
- Storage Provider (iOS): an interface between files inside an app and other apps on a user's device
- Custom Keyboard (iOS): system-wide alternative keyboards
Source: iOS 8 Extensions: Apple’s Plan for a Powerful App Ecosystem