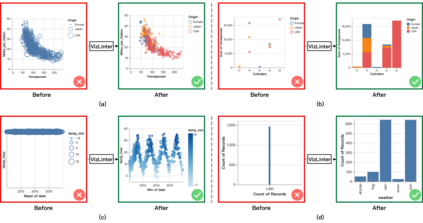
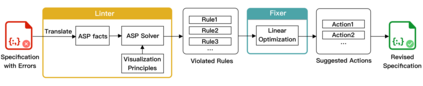
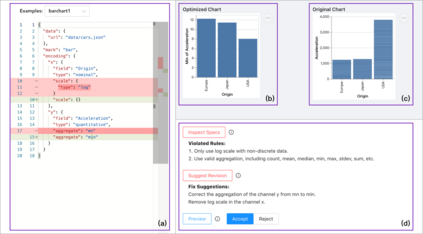
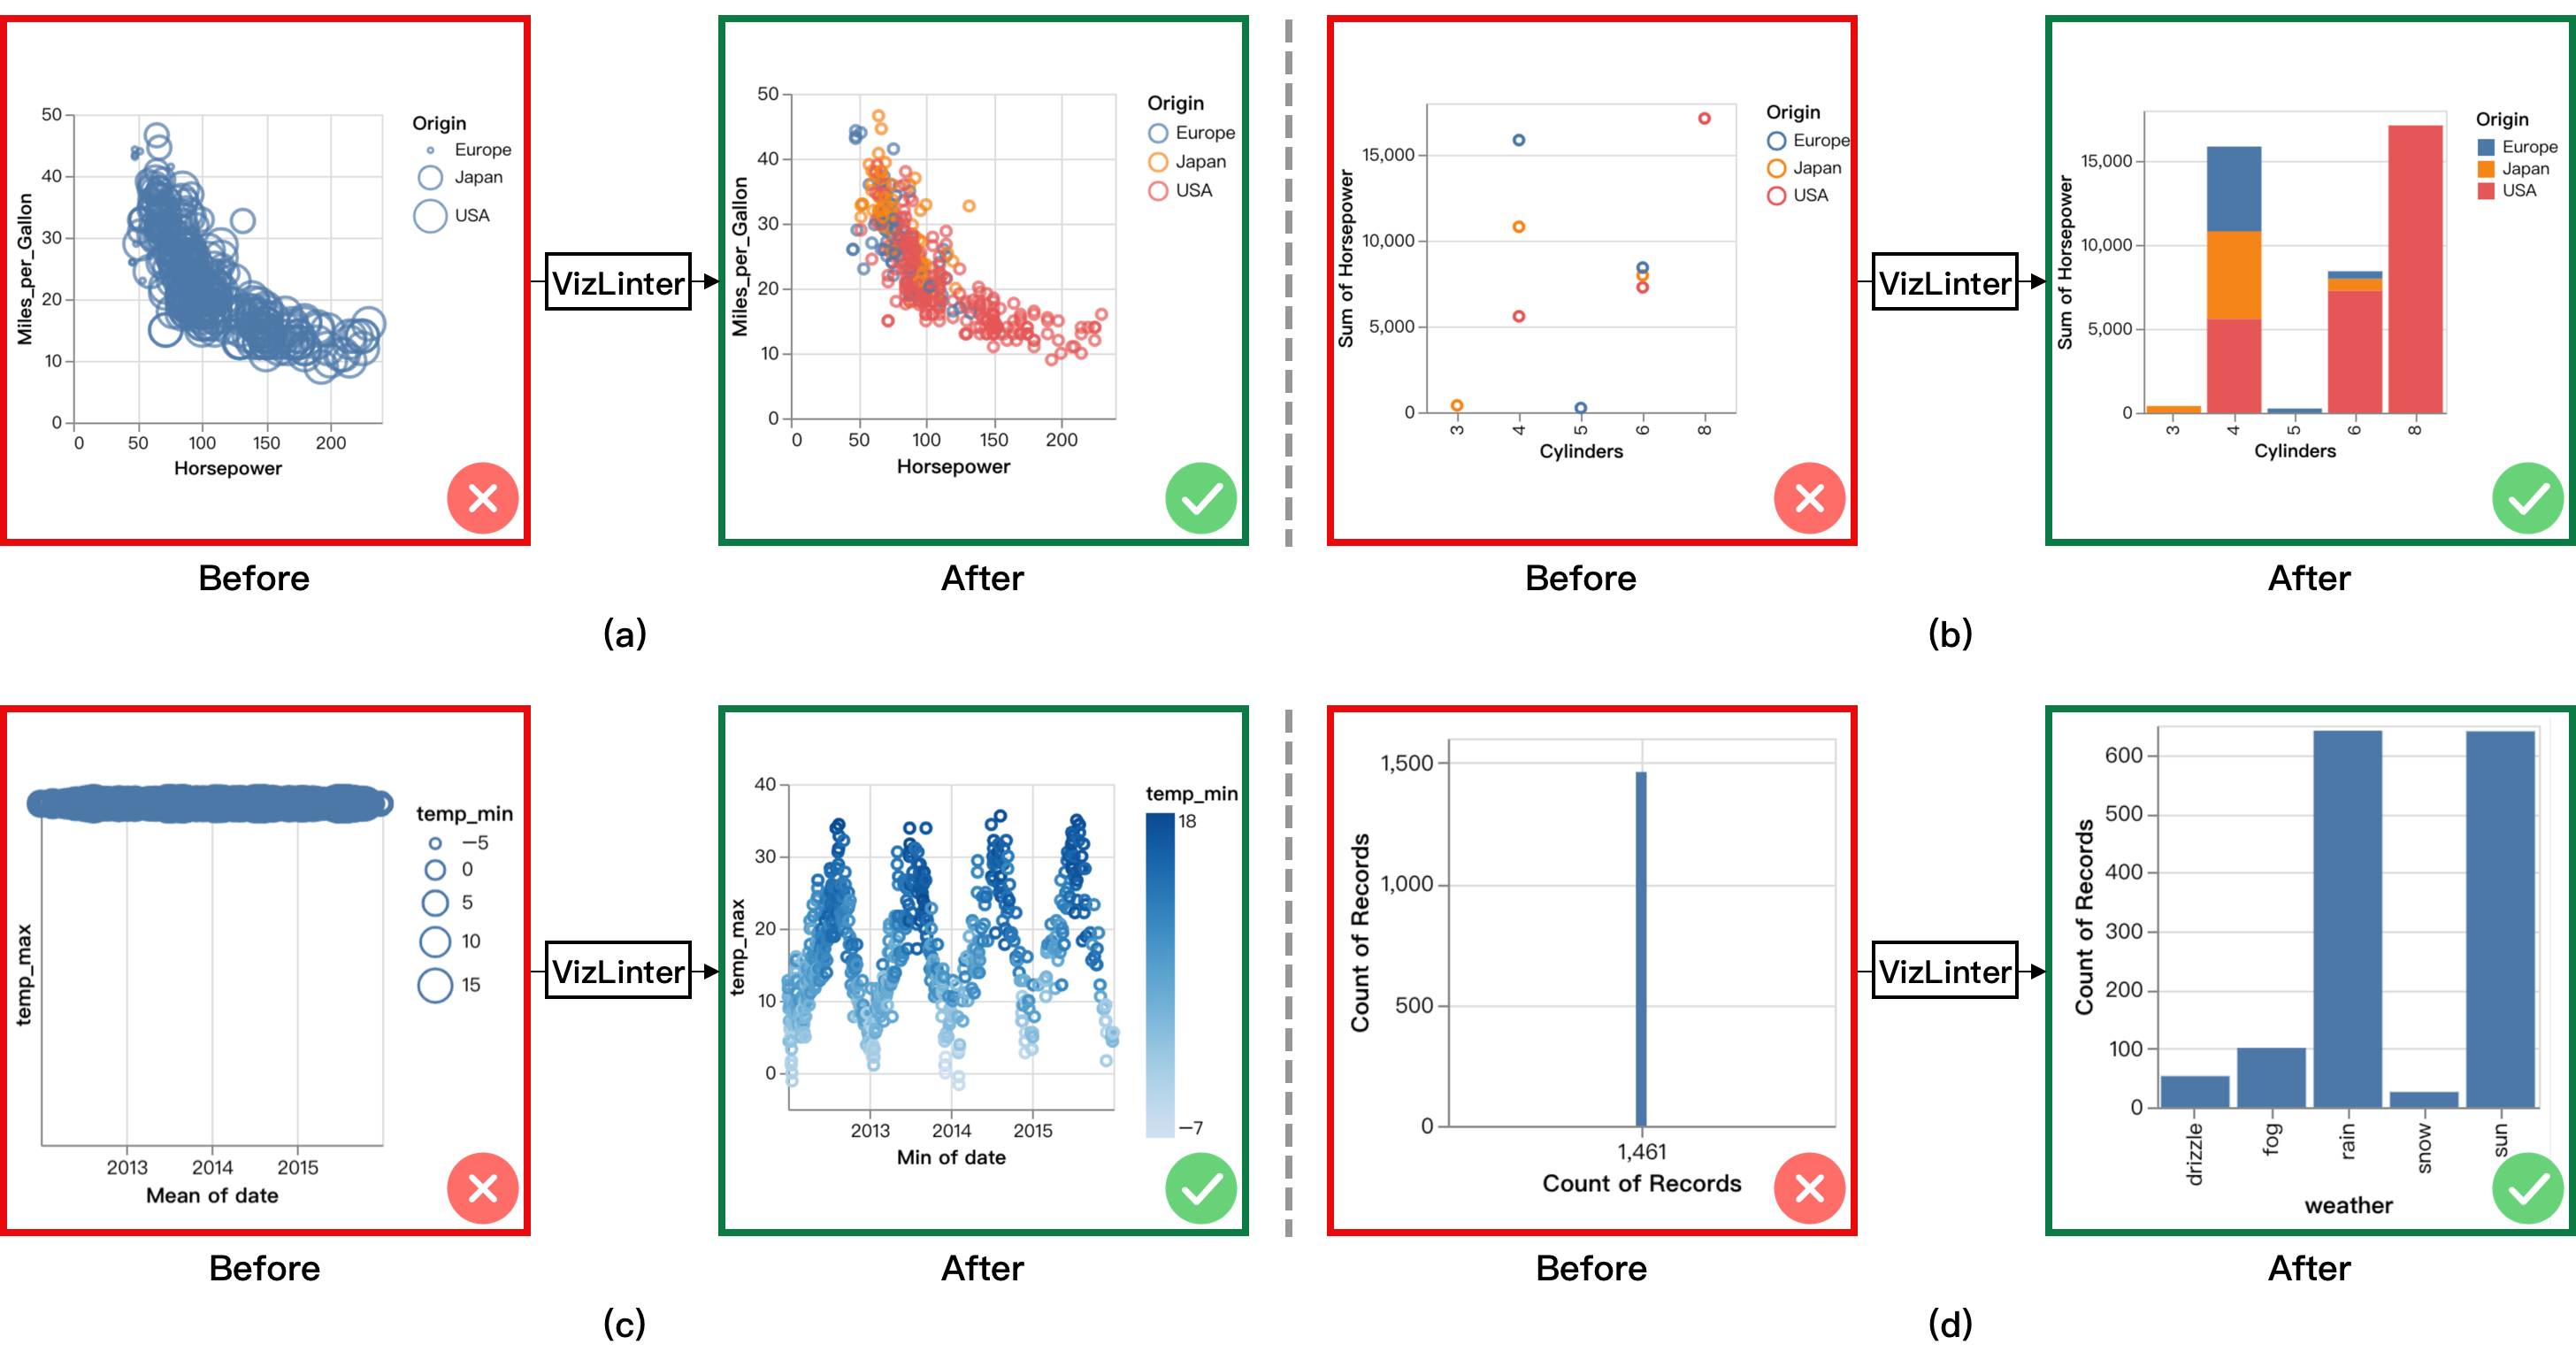
Despite the rising popularity of automated visualization tools, existing systems tend to provide direct results which do not always fit the input data or meet visualization requirements. Therefore, additional specification adjustments are still required in real-world use cases. However, manual adjustments are difficult since most users do not necessarily possess adequate skills or visualization knowledge. Even experienced users might create imperfect visualizations that involve chart construction errors. We present a framework, VizLinter, to help users detect flaws and rectify already-built but defective visualizations. The framework consists of two components, (1) a visualization linter, which applies well-recognized principles to inspect the legitimacy of rendered visualizations, and (2) a visualization fixer, which automatically corrects the detected violations according to the linter. We implement the framework into an online editor prototype based on Vega-Lite specifications. To further evaluate the system, we conduct an in-lab user study. The results prove its effectiveness and efficiency in identifying and fixing errors for data visualizations.
翻译:尽管自动化可视化工具越来越受欢迎,但现有系统往往提供直接结果,这些结果并不总是适合输入数据或满足可视化要求,因此,在现实世界使用的情况下,仍然需要对规格作更多的调整。然而,由于大多数用户不一定具备足够的技能或可视化知识,因此手工调整很困难。即使有经验的用户也可能造成不完美的可视化,涉及图表构造错误。我们提出了一个框架,即VizLinter,以帮助用户发现缺陷并纠正已经建立但有缺陷的可视化。框架由两个部分组成:(1)可视化线,它应用公认的原则来检查已实现可视化的合法性;和(2)可视化固定器,根据Linter自动纠正所发现的违规情况。我们根据Vega-Lite的规格将框架落实到一个在线编辑原型中。为了进一步评估这个系统,我们进行了实验室内用户研究。结果证明了它在识别和确定数据可视化错误方面的有效性和效率。