Any data analysis, especially the data sets that may be changing often or in real-time, consists of at least three important synchronized components: i) figuring out what to infer (objectives), ii) analysis or computation of objectives, and iii) understanding of the results which may require drill-down and/or visualization. There is a lot of attention paid to the first two of the above components as part of research whereas the understanding as well as deriving actionable decisions is quite tricky. Visualization is an important step towards both understanding (even by non-experts) and inferring the actions that need to be taken. As an example, for Covid-19, knowing regions (say, at the county or state level) that have seen a spike or prone to a spike in cases in the near future may warrant additional actions with respect to gatherings, business opening hours, etc. This paper focuses on an extensible architecture for visualization of base as well as analyzed data. This paper proposes a modular architecture of a dashboard for user-interaction, visualization management, and complex analysis of base data. The contributions of this paper are: i) extensibility of the architecture providing flexibility to add additional analysis, visualizations, and user interactions without changing the workflow, ii) decoupling of the functional modules to ease and speedup development by different groups, and iii) address efficiency issues for display response time. This paper uses Multilayer Networks (or MLNs) for analysis. To showcase the above, we present the implementation of a visualization dashboard, termed CoWiz++ (for Covid Wizard), and elaborate on how web-based user interaction and display components are interfaced seamlessly with the back end modules.
翻译:任何数据分析,特别是可能经常变化或实时变化的数据集,都至少包括三个重要的同步部分:一) 查明如何推断(目标),二) 分析或计算目标,三) 了解可能需要钻入和(或)可视化的结果;作为研究的一部分,对上述头两个部分的关注程度很高,而理解和得出可操作的决定则相当棘手;视觉化是朝着理解(甚至非专家)和判断需要采取的行动迈出的重要一步。例如,Covid-19, 了解区域(例如,州或州一级),知道区域(例如,知道区域),在近期内,可能需要钻入和(或)可视化。本文侧重于基础的可视化以及可分析的数据的扩展结构。本文提出了基于用户互动、可视化管理和基础数据复杂分析的仪表(基于用户互动、可视化管理和复杂分析的模块结构。本文的贡献是:i) 用户的高级网络的显示时间、可读性、可读性结构的升级和可视化性分析,为我们可视化结构的升级性分析提供了不同结构的升级性、可读性、可读性、可读性、可读性分析、可读性、可变性、可变性分析、可读性、可读性、可读性、可读性、可读性、可读性、可理解性、可读性、可读性、可读性、可变、可变、可读数据分析、可读性、可读性、可读性、可理解性、可读性、可变、可变、可变、可变、可变、可变、可变、可变、可变、可变、可变、可变、可变、可变、可变、可变、可变、可变、可变、可变、可变、可变、可变、可变、可变、可变、可变、可变、可变、可变、可变、可变、可变、可变、可变、可变、可变、可变、可变、可变、可变、可变、可变、可变、可变、可变、可变、可变、可变、可变、可变、可变、可变、可变、可变、可变、可变、可
相关内容
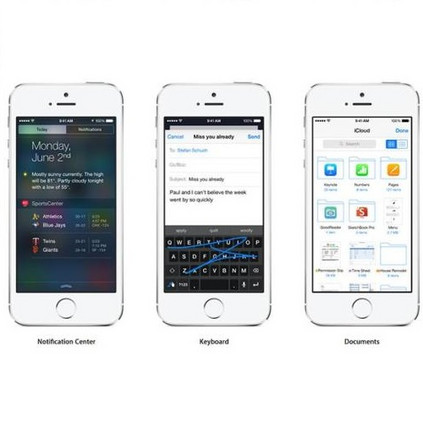
- Today (iOS and OS X): widgets for the Today view of Notification Center
- Share (iOS and OS X): post content to web services or share content with others
- Actions (iOS and OS X): app extensions to view or manipulate inside another app
- Photo Editing (iOS): edit a photo or video in Apple's Photos app with extensions from a third-party apps
- Finder Sync (OS X): remote file storage in the Finder with support for Finder content annotation
- Storage Provider (iOS): an interface between files inside an app and other apps on a user's device
- Custom Keyboard (iOS): system-wide alternative keyboards
Source: iOS 8 Extensions: Apple’s Plan for a Powerful App Ecosystem


