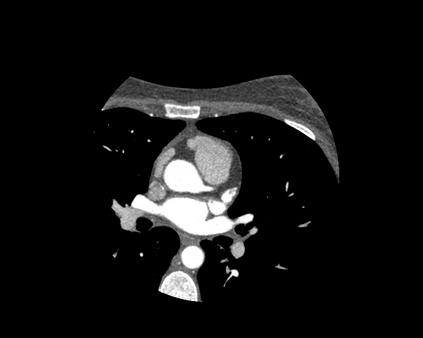
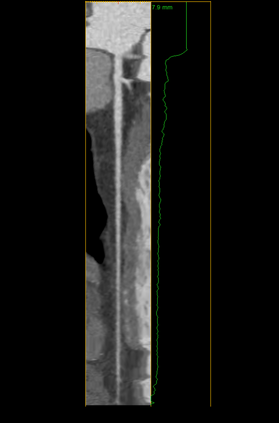
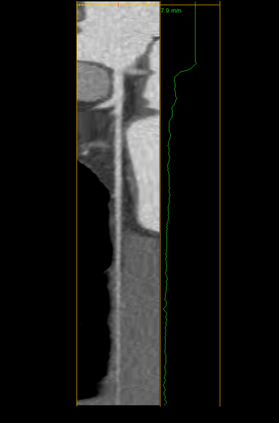
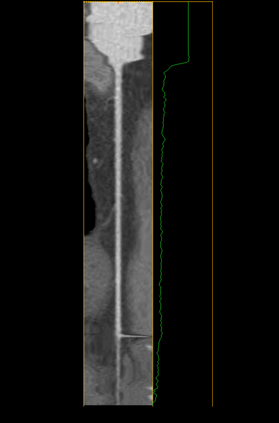
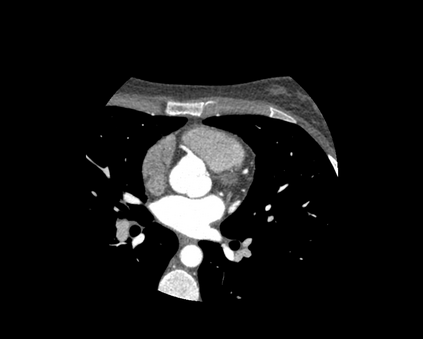
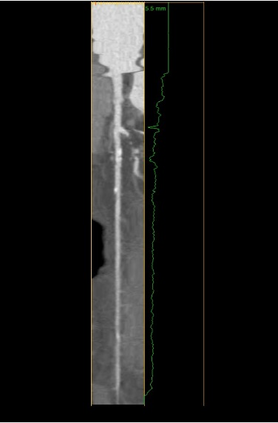
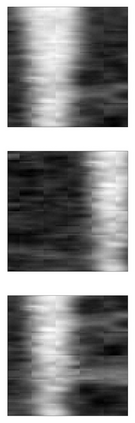
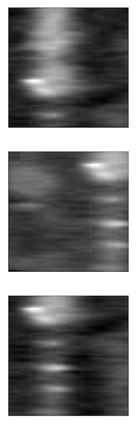
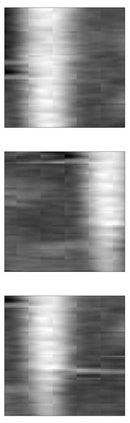
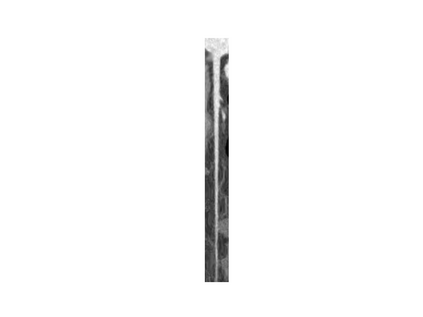
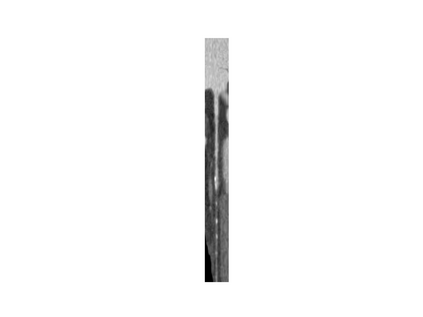
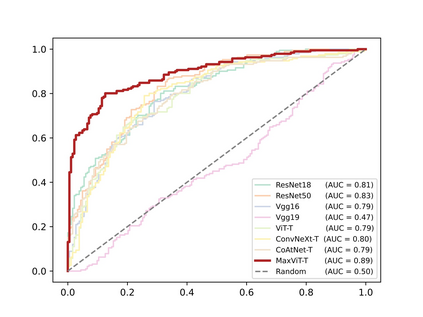
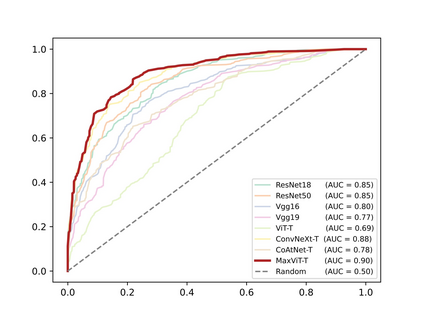
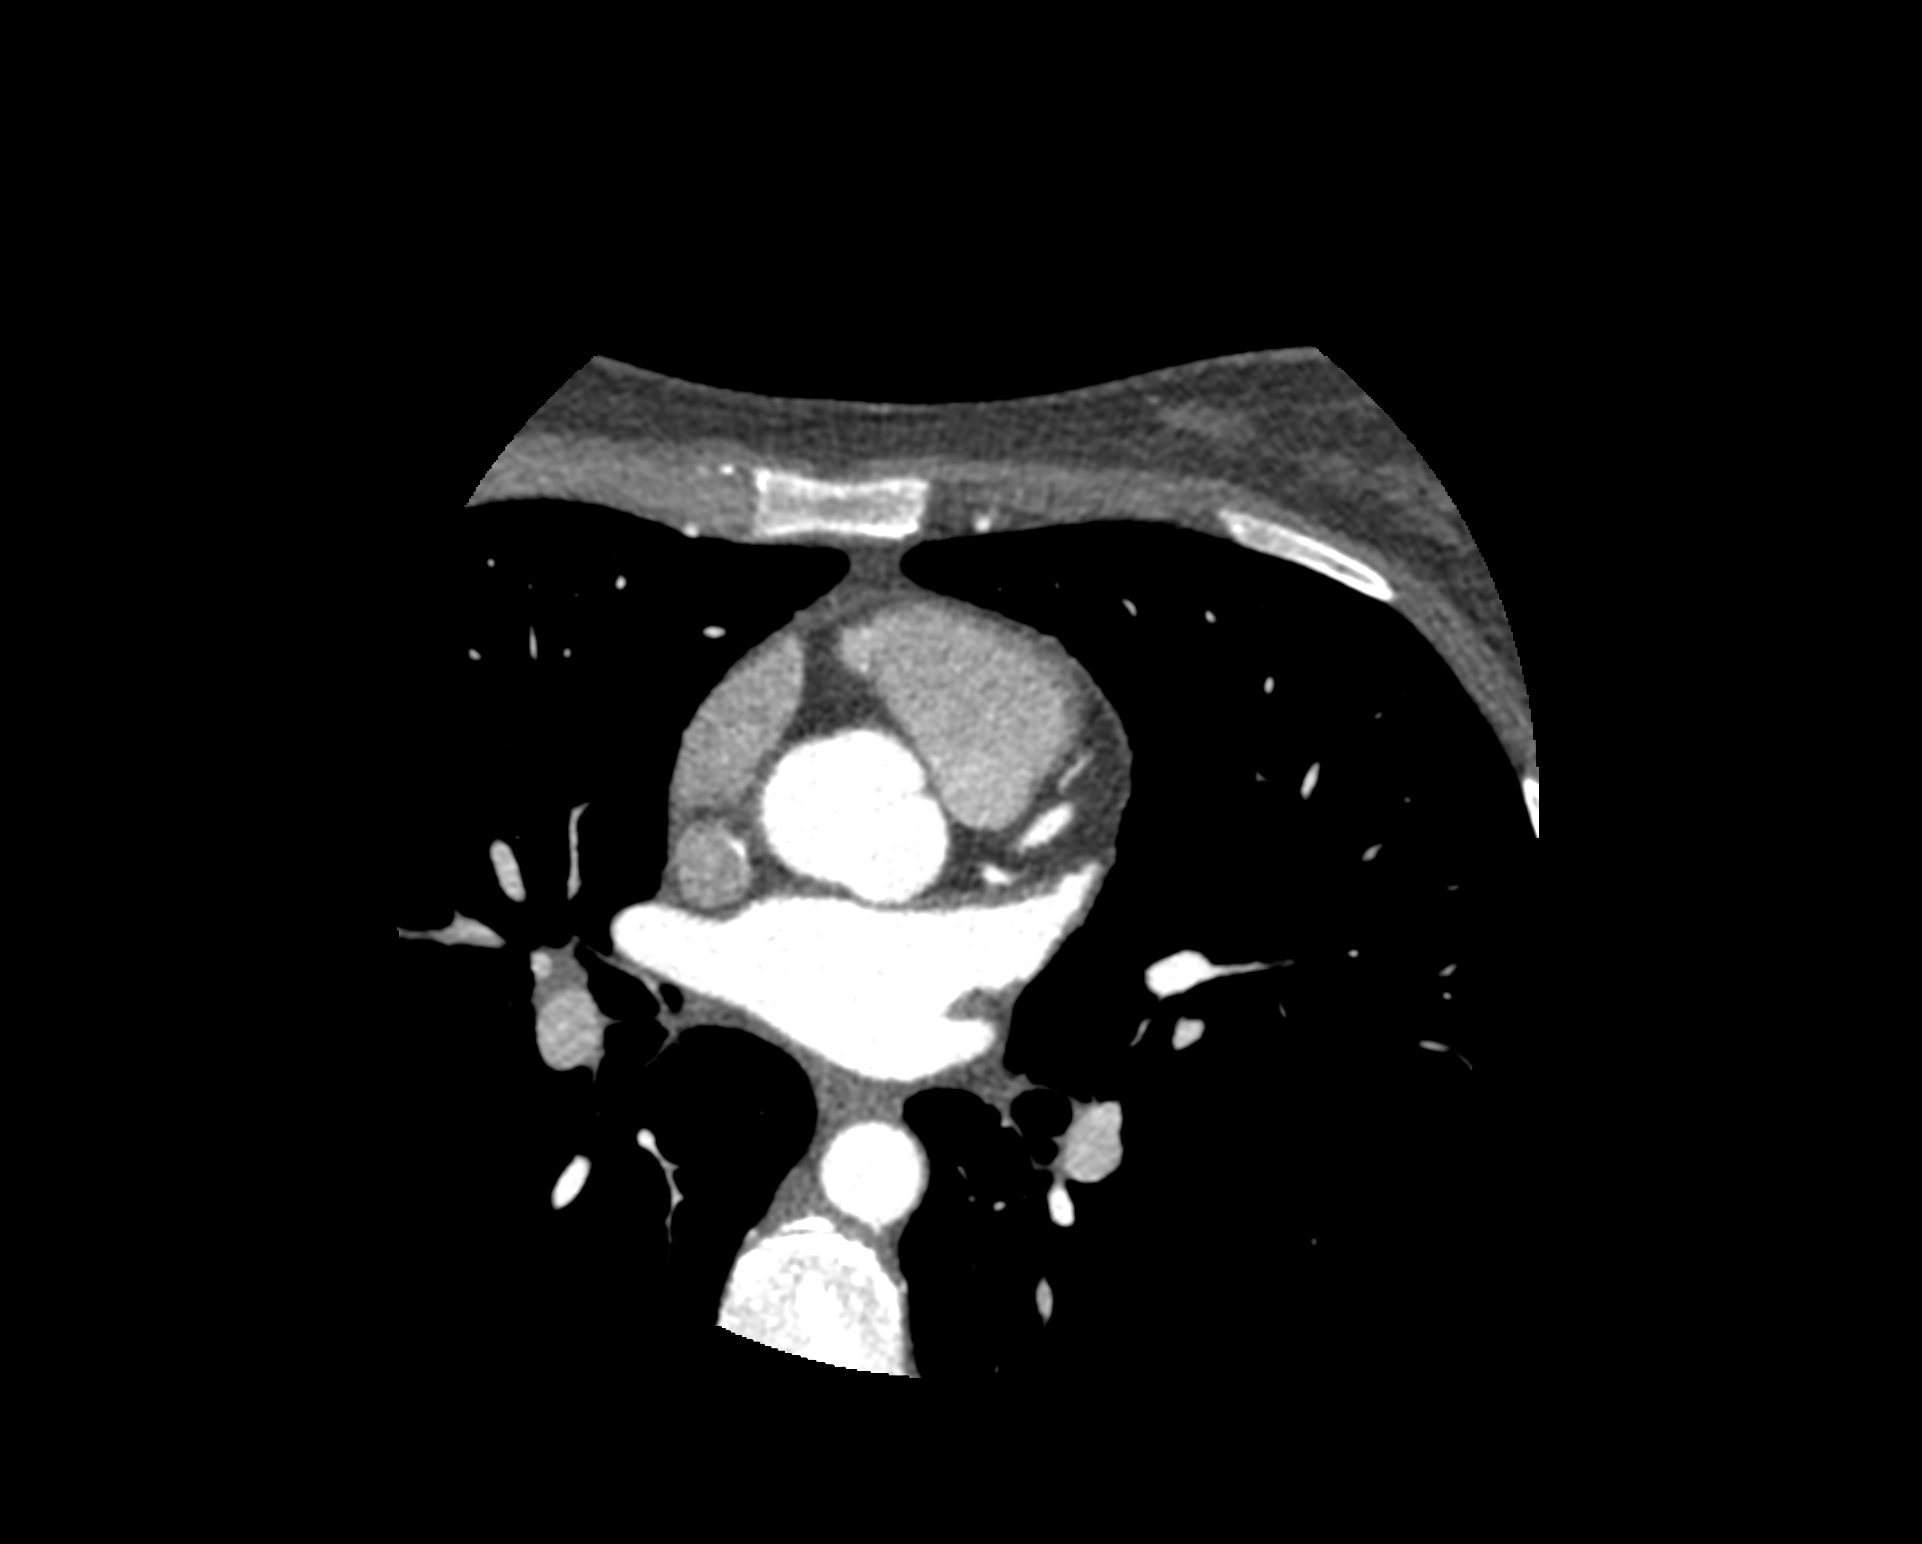
The standard non-invasive imaging technique used to assess the severity and extent of Coronary Artery Disease (CAD) is Coronary Computed Tomography Angiography (CCTA). However, manual grading of each patient's CCTA according to the CAD-Reporting and Data System (CAD-RADS) scoring is time-consuming and operator-dependent, especially in borderline cases. This work proposes a fully automated, and visually explainable, deep learning pipeline to be used as a decision support system for the CAD screening procedure. The pipeline performs two classification tasks: firstly, identifying patients who require further clinical investigations and secondly, classifying patients into subgroups based on the degree of stenosis, according to commonly used CAD-RADS thresholds. The pipeline pre-processes multiplanar projections of the coronary arteries, extracted from the original CCTAs, and classifies them using a fine-tuned Multi-Axis Vision Transformer architecture. With the aim of emulating the current clinical practice, the model is trained to assign a per-patient score by stacking the bi-dimensional longitudinal cross-sections of the three main coronary arteries along channel dimension. Furthermore, it generates visually interpretable maps to assess the reliability of the predictions. When run on a database of 1873 three-channel images of 253 patients collected at the Monzino Cardiology Center in Milan, the pipeline obtained an AUC of 0.87 and 0.93 for the two classification tasks, respectively. According to our knowledge, this is the first model trained to assign CAD-RADS scores learning solely from patient scores and not requiring finer imaging annotation steps that are not part of the clinical routine.
翻译:标准的非侵入性成像技术用于评估冠状动脉疾病(CAD)的严重程度和范围是冠状动脉计算机断层扫描(CCTA)。然而,根据CAD-报告和数据系统(CAD-RADS)评分手动对每名患者的CCTA进行分级,特别是在边缘病例中,耗时且操作员依赖性强。本工作提出了一种完全自动化的,可视化的深度学习流程,用作CAD筛查程序的决策支持系统。该流程执行两个分类任务:首先,识别需要进一步临床调查的患者;其次,根据常用的CAD-RADS阈值将患者分类为不同程度的狭窄子组。该流程对原始CCTA中提取的冠状动脉的多平面投影进行预处理,并使用经过微调的多轴视觉变换器架构进行分类。旨在模拟当前的临床实践,该模型被训练为通过将三个主要冠状动脉的二维纵向横截面沿通道维度叠加来分配每个患者的得分。此外,它生成可视化解释图以评估预测的可靠性。当在米兰莫尼诺心脏中心收集的253名患者的1873个三通道图像的数据库上运行时,该流程分别得到了0.87和0.93的两个分类任务的AUC。据我们所知,这是第一个仅从患者得分中学习分配CAD-RADS得分的模型,而不需要微调细化的成像注释步骤,这些步骤不是临床例行程序的一部分。