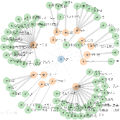
Knowledge graphs are a key technique for linking and integrating cross-domain data, concepts, tools, and knowledge to enable data-driven analytics. As much of the worlds data have become massive in size, visualizing graph entities and their interrelationships intuitively and interactively has become a crucial task for ingesting and better utilizing graph content to support semantic reasoning, discovering hidden knowledge discovering, and better scientific understanding of geophysical and social phenomena. Despite the fact that many such phenomena (e.g., disasters) have clear spatial footprints and geographical properties, their location information is considered only as a textual label in existing graph visualization tools, limiting their capability to reveal the geospatial distribution patterns of the graph nodes. In addition, most graph visualization techniques rely on 2D graph visualization, which constraints the dimensions of information that can be presented and lacks support for graph structure examination from multiple angles. To tackle the above challenges, we developed a novel 3D map-based graph visualization algorithm to enable interactive exploration of graph content and patterns in a spatially explicit manner. The algorithm extends a 3D force directed graph by integrating a web map, an additional geolocational force, and a force balancing variable that allows for the dynamic adjustment of the 3D graph structure and layout. This mechanism helps create a balanced graph view between the semantic forces among the graph nodes and the attractive force from a geolocation to a graph node. Our solution offers a new perspective in visualizing and understanding spatial entities and events in a knowledge graph.
翻译:知识图谱是将跨领域的数据、概念、工具和知识链接和集成起来,以支持数据驱动的分析的关键技术之一。由于许多世界上的数据已经非常庞大,因此直观和交互式地可视化图形实体及其相互关系已成为一个关键任务,以吸收和更好地利用图形内容,以支持语义推理,发现隐藏的知识,以及更好地科学理解地球物理和社会现象。尽管许多这样的现象(如灾害)具有明显的空间足迹和地理特性,但其位置信息在现有的图形可视化工具中仅被视为文本标签,从而限制了它们揭示图形节点的地理空间分布模式的能力。此外,大多数图形可视化技术依赖于二维图形可视化,这限制了可以呈现的信息维度,并且缺少从多个角度对图形结构进行检查的支持。为了应对上述挑战,我们开发了一种新颖的基于三维地图的图形可视化算法,以空间明确的方式启用图形内容和模式的交互式探索。该算法通过集成Web地图、附加地理定位力以及力平衡变量来扩展三维力导向图,从而允许动态调整三维图形结构和布局。这种机制有助于在图形节点之间的语义力和地理位置到图形节点的吸引力之间创建平衡的图形视图。我们的解决方案为可视化和理解知识图谱中的空间实体和事件提供了一种新的视角。


