gcIntermediate_航线图_必知必会
作者:李誉辉
四川大学在读研究生
简介
航线图,本质上是一种曲线,根据地理学知识,我们知道:
地球表面任意两点之间的最短距离等于:
过这两点,以地心为圆心,地球半径为半径的圆弧长度。
且这条圆弧是唯一的,只要知道圆弧2个端点的坐标,就能求出圆弧的方程,
由于圆弧的方程比较复杂,且端点改变,则方程也会相应发生变化,对于绘图不太方便。
所以只要求出圆弧上若干点的坐标,
然后使用base::lines()或ggplot2::geom_line()就能绘制曲线。
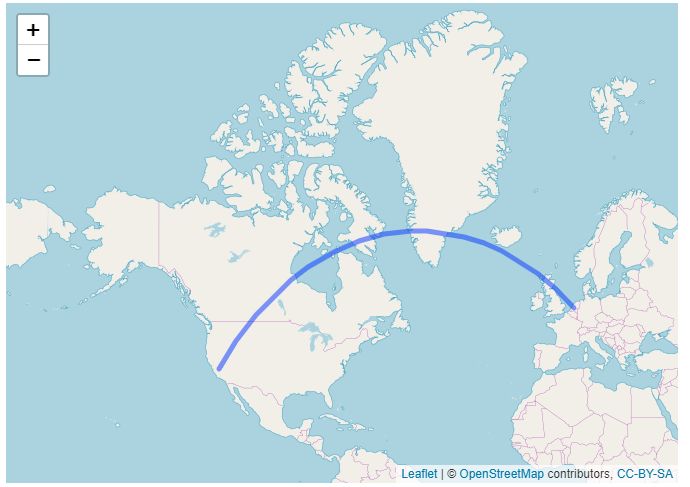
在leaflet中采用addPolylines()同样也能添加航线图。
所以关键在于求出2点构成的圆弧上若干点的坐标,
好在已经有封装好的函数了,这就是我们今天介绍的gcIntermediate()函数。
其来自geosphere包。
语法:
gcIntermediate(p1,p2,n=50,breakAtDateLine=FALSE,addStartEnd=FALSE,sp=FALSE,sepNA)
参数解释:
p1,表示起点坐标,可以用长度为2的数字向量指定,分别为经度/纬度。
也可以用2列数字矩阵指定,第1列为经度,第2列为纬度。
还可以用SpatialPoints对象指定。p2,表示终点坐标,用法与p1一致。n, 表示生成中间点的数量。breakAtDateLine, 为逻辑值,表示如果圆弧跨过了国际日期变更线时,是否返回2个矩阵。addStartEnd, 为逻辑值,表示返回的数据是否包括端点,TRUE则返回n + 2个。sp, 为逻辑值,表示是否返回SpatialLines对象。这在用tmap包绘图时非常方便。sepNA, 为逻辑值,表示当p1为多个点坐标时,是返回列表,
还是返回2列的矩阵,该矩阵中,使用NA行作为分割符,使各个圆弧之间的数据分开。
 1library(geosphere)
 2
 3# 计算2点之间的中间点坐标
 4line_points_1 <- gcIntermediate(c(168,-50), c(168,90), n = 5, addStartEnd = TRUE)
 5class(line_points_1);
 6line_points_1 # 返回5个中间点,2个端点,共7个点坐标
 7
 8# 多组点之间的中间点坐标
 9start_points <- rbind(c(168,-50), c(5,52))
10end_points <- rbind(c(168,90), c(20,52))
11line_points_2 <- gcIntermediate(start_points, end_points, n = 5, addStartEnd = TRUE)
12class(line_points_2) # 默认返回list
13line_points_2[[1]]; line_points_2[[2]] # 索引出来
14rm(start_points, end_points, line_points_1, line_points_2)
 1## [1] "matrix"
 2##      lon        lat
 3## [1,] 168 -50.000000
 4## [2,] 168 -26.666667
 5## [3,] 168  -3.333333
 6## [4,] 168  20.000000
 7## [5,] 168  43.333333
 8## [6,] 168  66.666667
 9## [7,] 168  90.000000
10## [1] "list"
11##      lon        lat
12## [1,] 168 -50.000000
13## [2,] 168 -26.666667
14## [3,] 168  -3.333333
15## [4,] 168  20.000000
16## [5,] 168  43.333333
17## [6,] 168  66.666667
18## [7,] 168  90.000000
19##            lon      lat
20## [1,]  5.000000 52.00000
21## [2,]  7.490089 52.13235
22## [3,]  9.992050 52.21199
23## [4,] 12.500000 52.23858
24## [5,] 15.007950 52.21199
25## [6,] 17.509911 52.13235
26## [7,] 20.000000 52.00000
1.1
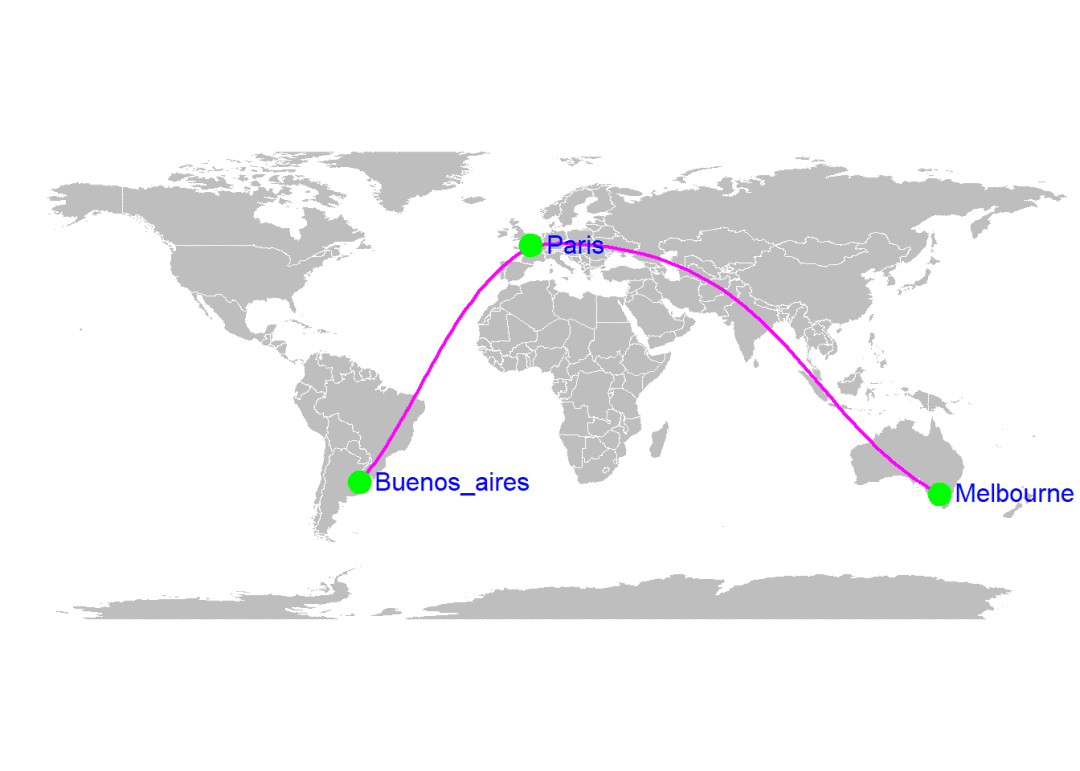
单条曲线
 1library(tidyverse)
 2library(maps)
 3library(geosphere)
 4
 5par(mar = c(0,0,0,0)) # 边距全部为0
 6
 7# 坐标点
 8Buenos_aires <- c(-58,-34) # 布宜诺斯艾利斯
 9Paris <- c(2,49)           # 巴黎
10Melbourne <- c(145,-38)    # 墨尔本
11points_data <- rbind(Buenos_aires, Paris, Melbourne) %>% as.data.frame()
12colnames(points_data) <- c("long","lat")
13
14# 计算中间点坐标
15inter_points_1 <- gcIntermediate(Paris,  Buenos_aires, n = 50, addStartEnd = TRUE)
16inter_points_2 <- gcIntermediate(Melbourne,  Paris, n = 50, addStartEnd = TRUE)
17
18# 画图
19## 地图底层
20map('world', col = "grey", fill = TRUE, bg = "white",
21    lwd = 0.05, mar = rep(0,4), border = 0, ylim = c(-80, 80))
22# 叠加曲线
23lines(inter_points_1, col = "magenta", lwd = 2) # 从巴黎到布宜诺斯艾利斯
24lines(inter_points_2, col = "magenta", lwd = 2) # 从墨尔本到巴黎
25## 叠加点
26points(x = points_data$long, y = points_data$lat,
27       col = "green", cex = 3, pch = 20)
28## 叠加文字
29text(x = points_data$long, y = points_data$lat,
30     labels = rownames(points_data), col = "blue", cex = 1, pos = 4)
1.2
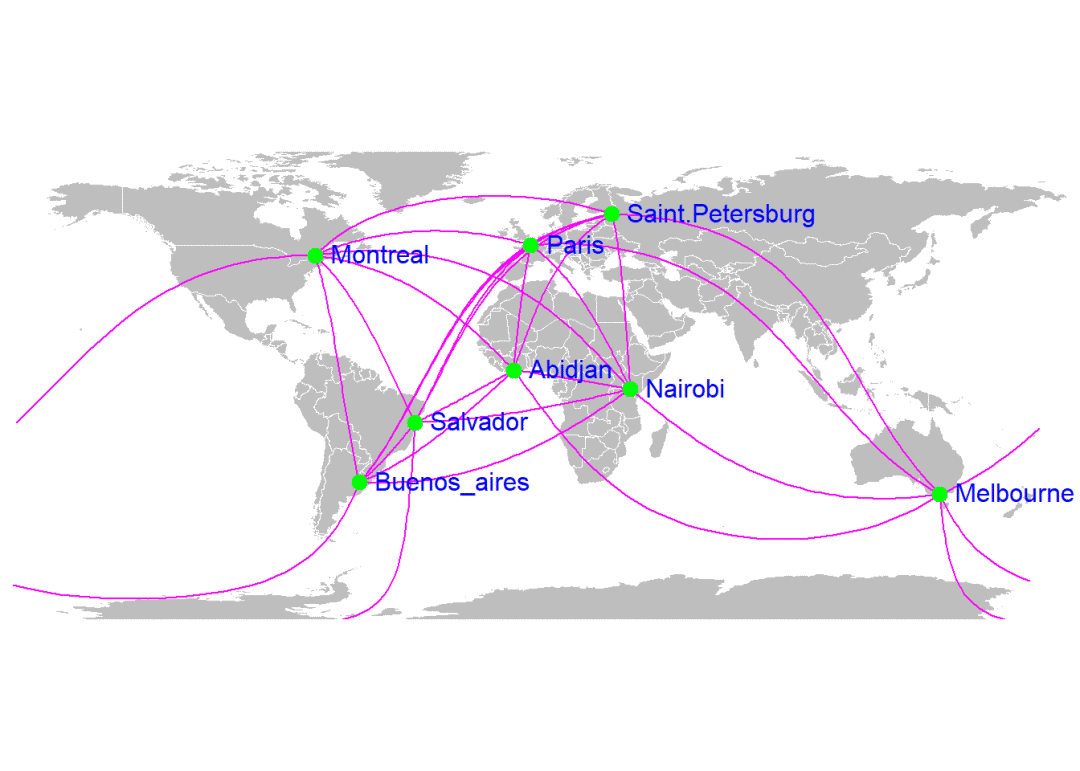
多条曲线
 1library(magrittr)
 2library(tidyverse)
 3library(maps)
 4library(geosphere)
 5
 6# 因为这里我们要绘制许多条曲线,不妨新建一个绘制曲线的函数,
 7## 用于绘制经过多个点的一条曲线。
 8plot_connection <- function(lon_1, lat_1, lon_2, lat_2, ...) {
 9    inter_points <- gcIntermediate(c(lon_1, lat_1), c(lon_2, lat_2),
10                                   n = 50, addStartEnd = TRUE)
11
12    inter_points <- data.frame(inter_points)
13    lon_diff <- abs(lon_1) + abs(lon_2)
14    # 因为地图底层中中间是0度经线
15    ## 若经度绝对值之和大于180,则分成2条曲线画,反之直接画一条曲线,
16    if(lon_diff > 180) {
17        lines(subset(inter_points, lon >= 0), ...)
18        lines(subset(inter_points, lon < 0), ...)
19    } else {
20        lines(inter_points, ...)
21        }
22}
23
24# 数据点坐标
25points_data <-  rbind(
26    Buenos_aires = c(-58,-34), # 布宜诺斯艾利斯
27    Paris = c(2,49),           # 巴黎
28    Melbourne = c(145,-38),    # 墨尔本
29    Saint.Petersburg = c(30.32, 59.93),# 圣彼得堡
30    Abidjan = c(-4.03, 5.33),   # 阿比让
31    Montreal = c(-73.57, 45.52),# 蒙特利尔
32    Nairobi = c(36.82, -1.29),  # 内罗毕
33    Salvador = c(-38.5, -12.97) # 萨尔瓦多
34    )  %>%
35  as.data.frame()
36colnames(points_data) <-  c("long","lat")
37
38# 排列组合,任意2个点之间的排列组合
39all_pairs <- cbind(t(combn(points_data$long, 2)),
40                   t(combn(points_data$lat, 2))) %>%
41  as.data.frame()
42colnames(all_pairs) <- c("long1", "long2", "lat1", "lat2")
43
44# 地图底层
45par(mar = c(0,0,0,0))
46map('world', col = "grey", fill = TRUE, bg = "white", lwd = 0.05,
47    mar = rep(0,4), border = 0, ylim = c(-80, 80))
48
49# 调动函数绘制曲线
50for(i in 1:nrow(all_pairs)) {
51    plot_connection(all_pairs$long1[i], all_pairs$lat1[i],
52                    all_pairs$long2[i], all_pairs$lat2[i],
53                    col = "magenta", lwd = 1)
54}
55
56# 增加点和文字
57points(x = points_data$long, y = points_data$lat,
58       col = "green", cex = 2, pch = 20)
59text(x = points_data$long, y = points_data$lat,
60     labels = rownames(points_data),
61     col = "blue", cex = 1, pos = 4)
2.1
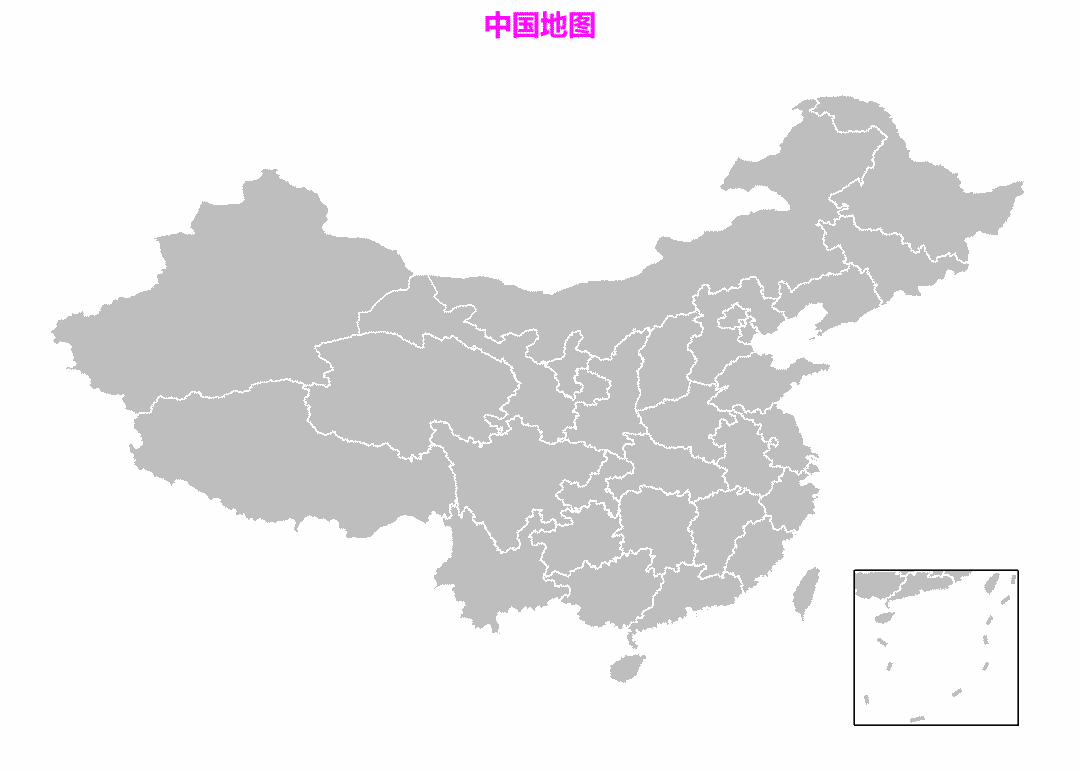
地图数据
 1library(ggplot2)
 2library(readr)
 3library(showtext)
 4
 5# 更改字体
 6windowsFonts(YaHei_rontine = windowsFont("微软雅黑"),
 7             Time_NewR = windowsFont("Times New Romans 常规"))
 8font_add("YaHei_rontine", regular = "msyh.ttc", bold = "msyhbd.ttc")
 9
10# 读取地图数据
11path_part_1 <- "E:/R_input_output/data_output/rds_documents/"
12Chinamap_with_mini <-
13  read_rds(path = paste0(path_part_1, "Chinamap_with_mini.rds"))
14Nine_lines_mini <-
15  read_rds(path = paste0(path_part_1, "Nine_lines_mini.rds"))
16rect_data <-
17  read_rds(path = paste0(path_part_1, "rect_data.rds"))
18
19# 绘图
20showtext_auto()
21ggplot() +
22  geom_polygon(data = Chinamap_with_mini,
23               aes(x = long, y = lat, group = interaction(class, group)),
24               fill = "grey", colour = "white", size = 0.5) +
25  # 增加小地图边框
26  geom_rect(aes(xmin = rect_data[2], xmax = rect_data[2] + rect_data[8] + 0.3,
27                ymin = rect_data[1] - 0.3, ymax = rect_data[1] + rect_data[7]),
28            fill = NA, colour = "black", size = 0.5) +
29  # 在小地图上增加南海九段线
30  geom_line(data = Nine_lines_mini,
31            aes(x = long, y = lat, group = ID),
32            colour = "grey", size = 1) +
33  ylim(15,55) +
34  labs(title = "中国地图") +
35  theme_void() +
36  theme(plot.title = element_text(
37        family = "YaHei_rontine", face = "bold",
38        colour = "magenta", hjust = 0.5),
39        panel.background = element_rect(fill = "white"),
40        panel.grid = element_blank())
41
42map_China <- ggplot() +
43  geom_polygon(data = Chinamap_with_mini,
44               aes(x = long, y = lat, group = interaction(class, group)),
45               fill = "grey", colour = "white", size = 0.5) +
46  # 增加小地图边框
47  geom_rect(aes(xmin = rect_data[2], xmax = rect_data[2] + rect_data[8] + 0.3,
48                ymin = rect_data[1] - 0.3, ymax = rect_data[1] + rect_data[7]),
49            fill = NA, colour = "black", size = 0.5) +
50  # 在小地图上增加南海九段线
51  geom_line(data = Nine_lines_mini,
52            aes(x = long, y = lat, group = ID),
53            colour = "grey", size = 1)
54
2.2
航班数据
 1library(readr)
 2library(magrittr)
 3library(dplyr)
 4library(geosphere)
 5
 6# 读取数据
 7airlines_CN <- read_csv(file = "E:/R_input_output/data_input/航班/国内航班数据new.csv",
 8                        locale = locale(encoding = "GBk")) # GBK避免中文乱码
 9
10important_cities <- read_csv(file = "E:/R_input_output/data_input/important_cities_CN.csv",
11                        locale = locale(encoding = "GBk")) # GBK避免中文乱码
12
13# 因为数据太大,只筛选重点城市(包括省会)之间的航班数据
14airlines_CN %<>% filter(Start_City %in% important_cities$City) %>%
15  filter(End_City %in% important_cities$City)
16
17# 筛选出机场坐标
18airports_CN_1 <- select(airlines_CN, Start_City, Start_long, Start_lat) %>%
19  group_by(Start_City) %>% slice(1) %>%
20  dplyr::rename(City = Start_City, long = Start_long, lat = Start_lat)
21
22airports_CN_2 <- select(airlines_CN, End_City, End_long, End_lat) %>%
23  group_by(End_City) %>% slice(1) %>%
24  dplyr::rename(City = End_City, long = End_long, lat = End_lat)
25
26airports_CN <- rbind(airports_CN_1, airports_CN_2)
27rm(airports_CN_1, airports_CN_2)
28
29# 计算中间点数据
30inter_points_data <- gcIntermediate(p1 = select(airlines_CN, Start_long, Start_lat),
31                                    p2 = select(airlines_CN, End_long, End_lat),
32                                    n = 50, addStartEnd = TRUE, sepNA = TRUE)
33inter_points_data %<>% as.data.frame()
34inter_points_data$group <- rep(1:nrow(airlines_CN), each = 50 + 3) %>%
35  .[-length(.)] # 移除最后一位,因为最后一位不是NA
36
37head(airlines_CN)
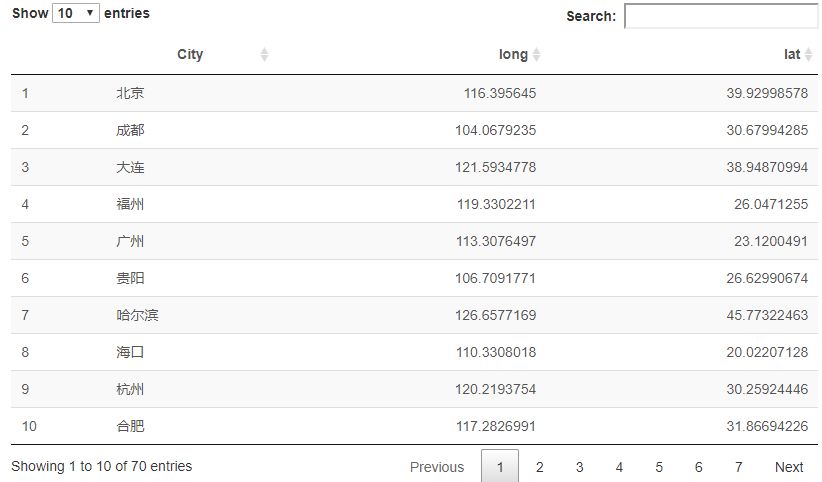
38DT::datatable(airports_CN)
39head(inter_points_data)
(实际效果可交互)
2.3
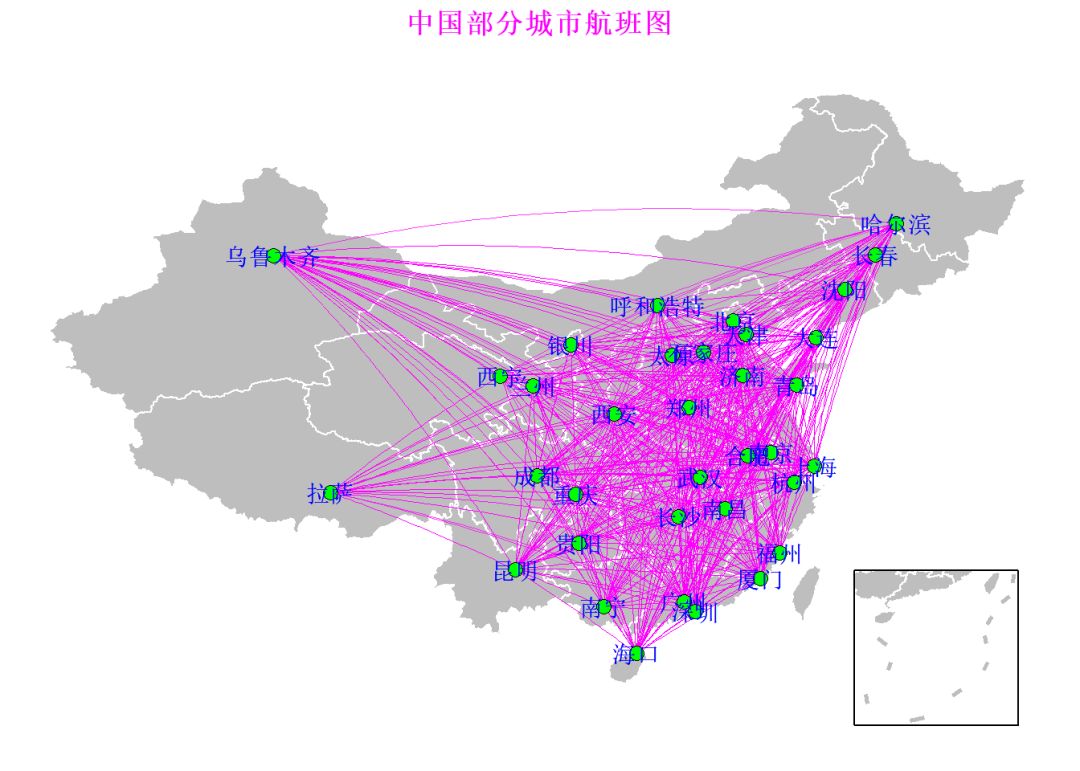
绘制航线图
 1library(ggplot2)
 2
 3showtext_auto()
 4map_China +
 5  geom_line(data = inter_points_data,
 6            aes(x = lon, y = lat, group = group),
 7            color = "magenta", size = 0.25, alpha = 0.5) +
 8  geom_point(data = airports_CN,
 9             aes(x = long, y = lat),
10             shape = 21, fill = "green", size = 3) +
11  geom_text(data = airports_CN,
12            aes(x = long, y = lat, label = City),
13            color = "blue", family = "YaHei_rontine") +
14  ylim(15,55) +
15  labs(title = "中国部分城市航班图") +
16  theme_void() +
17  theme(plot.title = element_text(
18        family = "YaHei_rontine", face = "bold",
19        colour = "magenta", hjust = 0.5),
20        panel.background = element_rect(fill = "white"),
21        panel.grid = element_blank())
对leaflet不熟悉的可以参考 R_leaflet包_最易上手地图教程(二)
 1library(leaflet)
 2library(geosphere)
 3
 4gcIntermediate(c(5,52), c(-120,37),
 5               n = 100,
 6               addStartEnd = TRUE,
 7               sp = TRUE) %>%
 8leaflet() %>%
 9addTiles() %>%
10addPolylines()
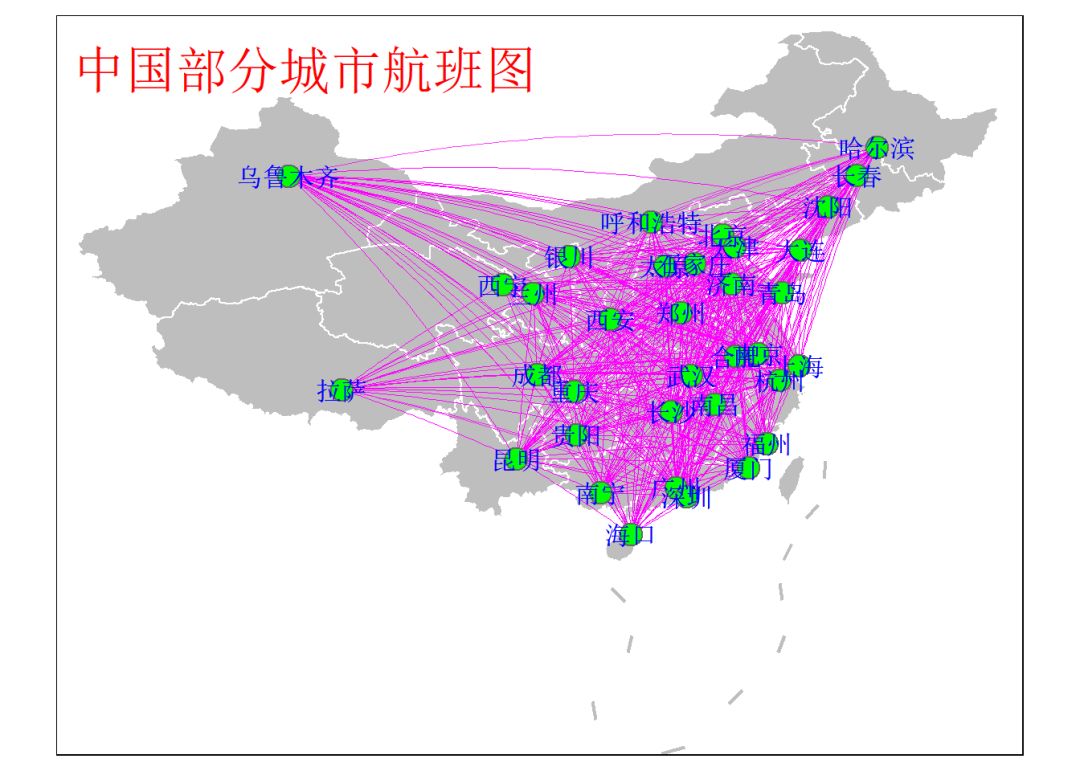
tmap包支持sf和sp对象,这里我们直接使用geIntermediate生成sp对象。
4.1
数据处理
 1library(sp)
 2library(readr)
 3library(dplyr)
 4
 5# 计算中间点数据
 6inter_points_sp <- gcIntermediate(p1 = select(airlines_CN, Start_long, Start_lat),
 7                                  p2 = select(airlines_CN, End_long, End_lat),
 8                                  n = 50, addStartEnd = TRUE, sp = TRUE)
 9proj4string(inter_points_sp) <- CRS("+proj=aea +lat_1=25 +lat_2=50 +lon_0=105")
10
11# 读取中国省级地图数据
12path_part_1 <- "E:/R_input_output/data_output/rds_documents/"
13Chinaprovinces_sp <-
14  read_rds(path = paste0(path_part_1, "Chinaprovinces_sp.rds"))
15# 读取南海九段线地图数据
16Nine_lines_sp <-
17  read_rds(path = paste0(path_part_1, "Nine_lines_sp.rds"))
18# 将机场数据转化为sp对象
19airports_CN_sp <- SpatialPointsDataFrame(coords = cbind(x = airports_CN$long,
20                                                        y = airports_CN$lat),
21                                       data = dplyr::select(airports_CN, City),
22                                       proj4string =
23                                         CRS("+proj=aea +lat_1=25 +lat_2=50 +lon_0=105"))
24
4.2
绘图
 1library(tmap)
 2
 3showtext_auto()
 4tm_shape(shp = Chinaprovinces_sp) +
 5      tm_polygons(col = "grey", border.col = "white") +
 6      tm_shape(shp = Nine_lines_sp) +
 7      tm_lines(col = "grey", lwd = 2) +
 8      tm_shape(shp = inter_points_sp) +
 9      tm_lines(col = "magenta", lwd = 0.25, alpha = 0.5) +
10      tm_shape(shp = airports_CN_sp) +
11      tm_dots(col = "green", size = 1, shape = 21) +
12      tm_text(text = "City", fontfamily = "YaHei_rontine", col = "blue") +
13      tm_layout(title = "中国部分城市航班图",
14                title.size = 2, title.color = "red",
15                title.fontfamily = "YaHei_rontine")
参
考来源
Leaflet航线图
https://stackoverflow.com/questions/34499212/adding-curved-flight-path-using-rs-leaflet-package
Drawing curved lines between points in ggmap
https://stackoverflow.com/questions/23601678/drawing-curved-lines-between-points-in-ggmap
How to draw connecting routes on map with R and great circles
https://www.r-bloggers.com/how-to-draw-connecting-routes-on-map-with-r-and-great-circles/
DRAW CURVED LINES ON A MAP!
https://dataviz.love/2017/02/13/draw-curved-lines-map/
geom_line
https://ggplot2.tidyverse.org/reference/geom_path.html
Welcome to Mapping with R
http://clarkdatalabs.github.io/mapping_R/
gcIntermediate函数
https://rdrr.io/cran/geosphere/src/R/gcIntermediate.R
国际日期变更线的意义
https://www.zhihu.com/question/27910343
——————————————
往期精彩:

