微课|R基础绘图:直方图
今日问题
直方图整体外观美化.
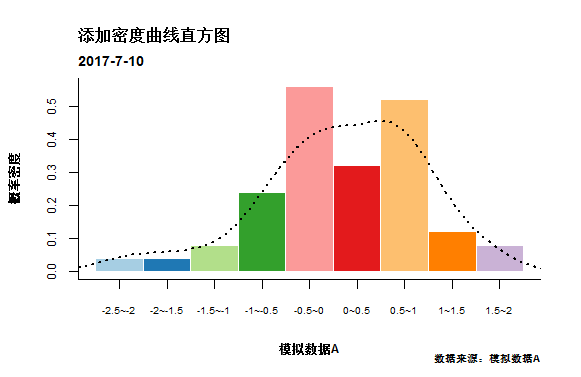
为直方图添加密度曲线.
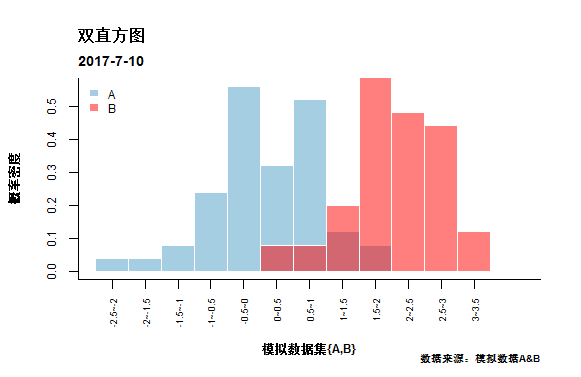
绘制多峰直方图.
这次微课使用模拟数据集,其中数据A服从标准正态分布,B服从均值为2方差为0.8的正态分布. 设置随机种子set.seed(1)
set.seed(1)
A <- rnorm(50,0,1)
set.seed(1)
#注意随机种子只对当前命令起作用
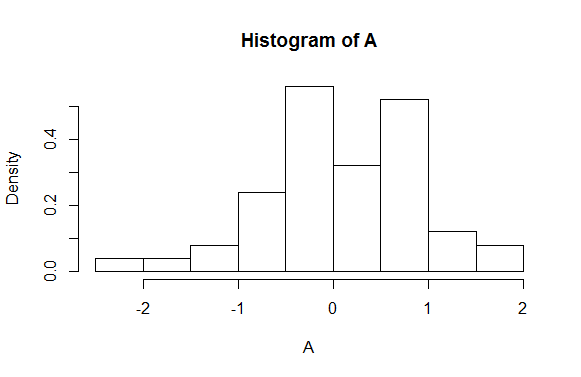
B <- rnorm(50,2,0.8)hist(x, breaks,freq, ....), 其中x表示一个向量,breaks表示直方图竖条的个数,freq是一个逻辑变量,默认绘制频率直方图,逻辑假绘制概率直方图.
hist(A, breaks=10, freq=FALSE)直方图的横坐标通常表示向量x的分位数,例如breaks=10,向量X被均分成10份. 用break1~break2的形式表示X轴的坐标, 使用如下命令取出分位数.
hi_data=hist(A,plot = F)
bra_hidata=hi_data$breaks
#-2.5 -2.0 -1.5 -1.0 -0.5  0.0  0.5  1.0  1.5  2.0
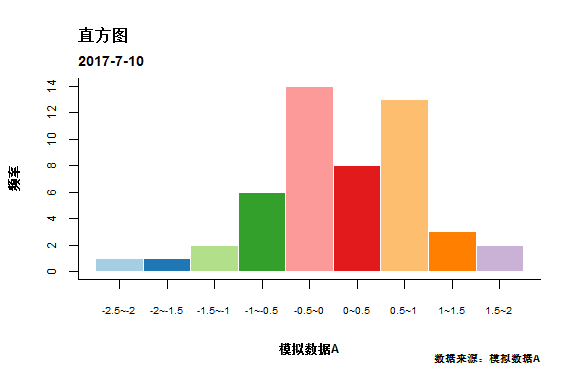
制作坐标标签.
nlab=paste(bra_hidata[-10],bra_hidata[-1],sep = '~')
nlab
#"-2.5~-2" "-2~-1.5" "-1.5~-1" "-1~-0.5" "-0.5~0" "0~0.5"
#"0.5~1" "1~1.5" "1.5~2
最后对图像原色的字体,颜色,大小,位置进行调整,详解请参照前几节课的内容.
library(RColorBrewer)
cols=brewer.pal(9, 'Paired')
hist(A,breaks =10,col = cols,border = 'white',
   cex.axis=0.75,cex.lab=0.75,font.lab=2, xaxt='n',
   xlab = '模拟数据A',ylab = '频率',main = NULL)
box(bty='l')
hi_data=hist(A,plot = F)
bra_hidata=hi_data$breaks
nlab=paste(bra_hidata[-10],bra_hidata[-1],sep = '~')
#设置坐标标签
axis(1,at=bra_hidata[-10]/2+bra_hidata[-1]/2,
    labels = nlab,cex.axis=0.65)
mtext("直方图",3,line = 1.8,adj=0,font=2)
mtext('2017-7-10',3,line = 0.5,adj = 0, cex = 0.85,font = 2)
mtext("数据来源:模拟数据A",1,line=3.5,adj=1,cex=0.65,font=2)
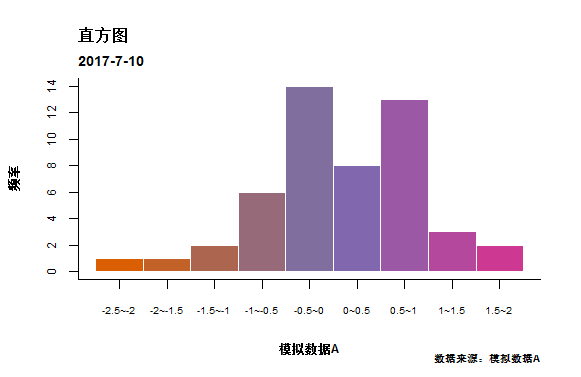
上图使用离散色进行填充,下面使用渐进色填充直方图.
col1=brewer.pal(8, 'Dark2')
YlOrBr <- col1[2:4]
cols=brewer.pal(9, 'Paired')
hist(A,breaks =10,col =  colorRampPalette(YlOrBr)(10),
    border = 'white',cex.axis=0.75,cex.lab=0.75,
    font.lab=2, xaxt='n', xlab = '模拟数据A',
    ylab = '频率',main = NULL)
#................
#下面代码和离散填充一致#上面代码和离散填充一致
#..................
lines(density(A), lwd = 2,lty=3)hist(A,breaks =10,col = cols[1],border = 'white',freq = FALSE,
cex.axis=0.75,cex.lab=0.75,font.lab=2, xaxt='n',
xlab = NULL,ylab = NULL,main = NULL,
xlim = c(-2.5,4)
)
hist(B,breaks =10,col = scales::alpha('red',0.5),border = 'white',
cex.axis=0.75,cex.lab=0.75,font.lab=2, xaxt='n',freq = FALSE,
xlab = NULL,ylab = NULL,main = NULL,
xlim = c(-2.5,4),add=T)
box(bty='l')
hi_data1=hist(A,plot = F)
hi_data2=hist(B,plot = F)
bra_hidata1=hi_data1$breaks
bra_hidata2=hi_data2$breaks
bra_hidata=unique(c(bra_hidata1,bra_hidata2))
nlab=paste(bra_hidata[-13],bra_hidata[-1],sep = '~')
#调整坐标以及主副标题和注解
axis(1,at=bra_hidata[-13]/2+bra_hidata[-1]/2,labels = nlab,
cex.axis=0.55,las=2)
mtext("双直方图",3,line = 1.8,adj=0,font=2)
mtext('2017-7-10',3,line = 0.5,adj = 0, cex = 0.85,font = 2)
mtext("数据来源:模拟数据A",1,line=3.5,adj=1,cex=0.65,font=2)
title(xlab='模拟数据集{A,B}',ylab='概率密度',cex.lab=0.75,font.lab=2)
#绘制图例
legend('topleft',c('A','B'),fill = c(cols[1],scales::alpha('red',0.5)),
border = 'white',cex = 0.75,
bty = "n")推荐阅读
更多微课请关注【数萃大数据】公众号,点击学习园地—可视化

欢迎参加【杭州站】Python大数据分析培训
8月18日-22日
扫描右侧二维码了解更多

登录查看更多
