独家 | 基于NLP的COVID-19虚假新闻检测(附代码)

翻译:杨毅远
校对:吴金笛
本文长度为4400字,建议阅读8分钟

https://raw.githubusercontent.com/susanli2016/NLP-with-Python/master/data/corona_fake.csv
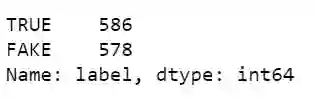
1. from nltk.corpus import stopwords2. STOPWORDS = set(stopwords.words('english'))3. from sklearn.feature_extraction.text import CountVectorizer4.5. from textblob import TextBlob6. import plotly.express as px7. import plotly.figure_factory as ff8. import plotly.graph_objects as go9.10. df = pd.read_csv('data/corona_fake.csv')11. df.loc[df['label'] == 'Fake', ['label']] = 'FAKE'12. df.loc[df['label'] == 'fake', ['label']] = 'FAKE'13. df.loc[df['source'] == 'facebook', ['source']] = 'Facebook'14.15. df.loc[5]['label'] = 'FAKE'16. df.loc[15]['label'] = 'TRUE'17. df.loc[43]['label'] = 'FAKE'18. df.loc[131]['label'] = 'TRUE'19. df.loc[242]['label'] = 'FAKE'20.21. df = df.sample(frac=1).reset_index(drop=True)22. df.label.value_counts()
process_data.py
df.loc[df['label'] == 'TRUE'].source.value_counts()
df.loc[df['label'] == 'FAKE'].source.value_counts()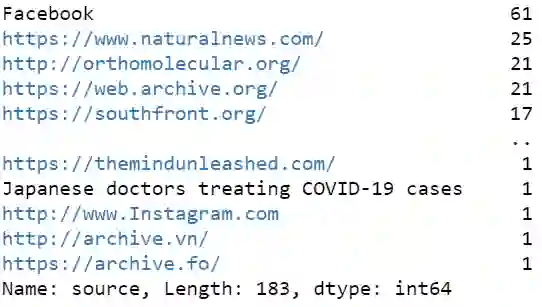
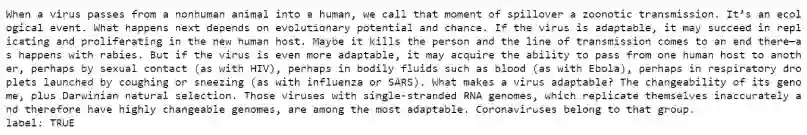
1. def print_plot(index):2. example = df[df.index == index][['text','label']].values[0]3. if len(example) > 0:4. print(example[0])5. print('label:', example[1])6.7. print_plot(500)
print_plot.py

print_plot(1000)
由于我们数据集中文章内容很清晰,所以我们仅需要删除标点符号并将大写字母改为小写即可。
1. df['text'] = df['text'].str.replace('[^\w\s]','')2. df['text'] = df['text'].str.lower()
获取每篇新闻的情感得分,而且分数控制在[-1,1]范围内,其中1表示积极情绪,-1表示消极情绪。
获取每篇文章的长度(字数)。
df['polarity'] = df['text'].map(lambda text: TextBlob(text).sentiment.polarity)def text_len(x):if type(x) is str:return len(x.split())else:return 0df['text_len'] = df['text'].apply(text_len)nums_text = df.query('text_len > 0')['text_len']fig = ff.create_distplot(hist_data = [nums_text], group_labels = ['Text'])fig.update_layout(title_text='Distribution of article length', template="plotly_white")fig.show()
polarity_length.py
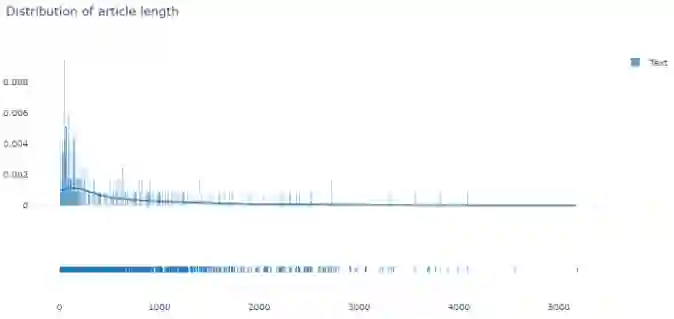
图三
1. fig = px.histogram(df, x="text_len", y="text", color="label",2. marginal="box",3. hover_data=df.columns, nbins=100)4. fig.update_layout(title_text='Distribution of article length', template="plotly_white")5. fig.show()text_len_hist.py
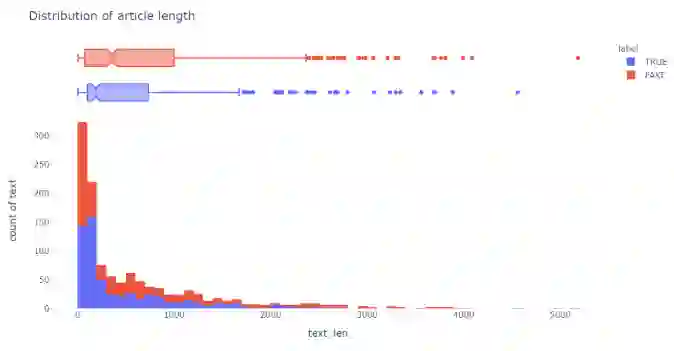
图四
为了显示不同新闻的文本长度的概率密度,我们使用小提琴图(violin plot)表示:
1. fig = px.violin(df, y='text_len', color='label',2. violinmode='overlay',3. hover_data=df.columns, template='plotly_white')4. fig.show()
text_len_violin.py

图五
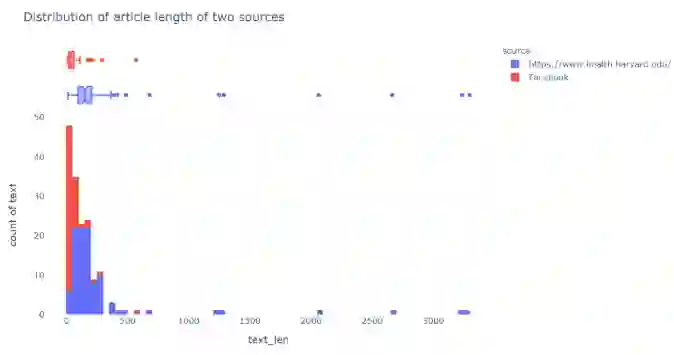
Facebook vs. Harvard
平均而言,Facebook的帖子比哈佛健康的文章短得多:
1. df_new = df.loc[(df['source'] == 'Facebook') | (df['source'] == 'https://www.health.harvard.edu/')]2.3. fig = px.histogram(df_new, x="text_len", y="text", color='source',4. marginal="box",5. hover_data=df_new.columns, nbins=100)6. fig.update_layout(title_text='Distribution of article length of two sources', template="plotly_white")7. fig.show()
facebook_harvard_textlen_hist.py
1. fig = px.violin(df_new, y='text_len', color='source',2. violinmode='overlay',3. hover_data=df_new.columns, template='plotly_white')4. fig.show()
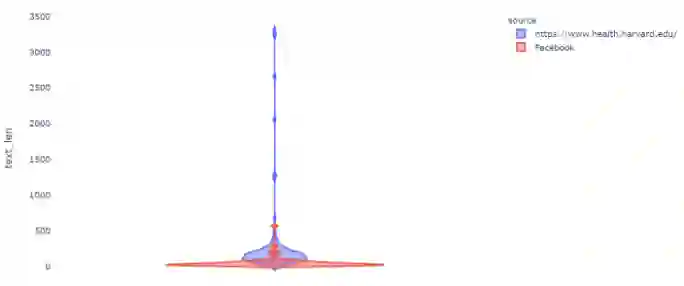
图七
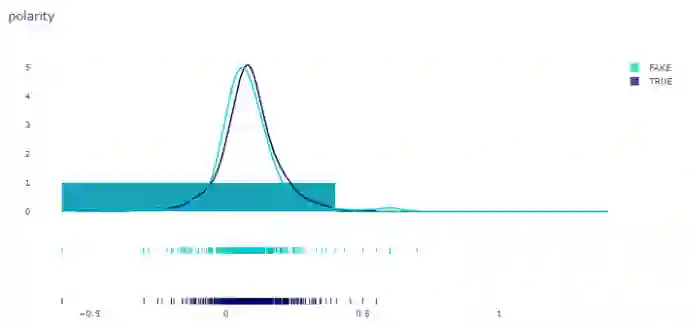
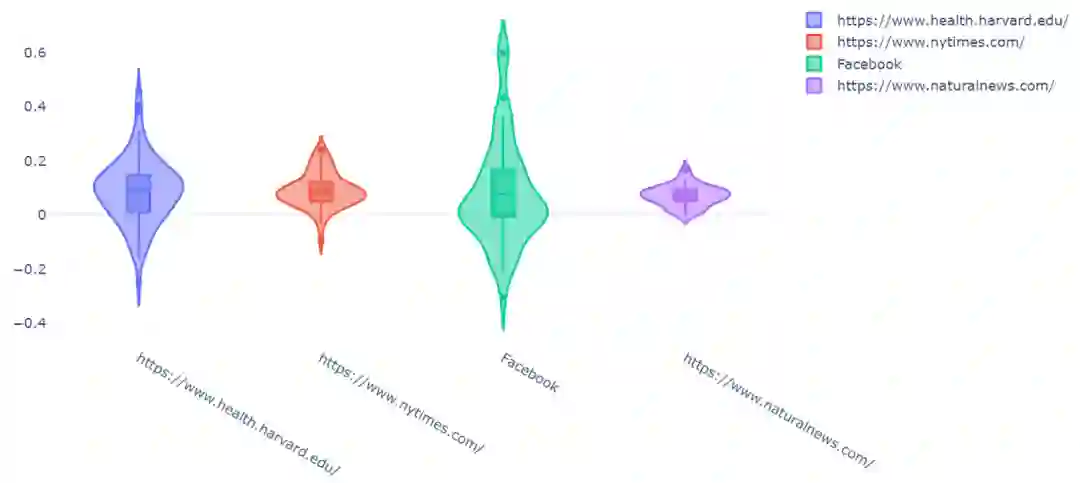
情感极性
1. x1 = df.loc[df['label']=='TRUE']['polarity']2. x2 = df.loc[df['label'] == 'FAKE']['polarity']3.4. group_labels = ['TRUE', 'FAKE']5.6. colors = ['rgb(0, 0, 100)', 'rgb(0, 200, 200)']7.8. fig = ff.create_distplot(9. [x1, x2], group_labels,colors=colors)10.11. fig.update_layout(title_text='polarity', template="plotly_white")12. fig.show()
label_polarity.py
1. fig = p.violin(df, y='polarity', color="label",2. violinmode='overlay',3. template='plotly_white')4. fig.show()

1. x1 = df.loc[df['source']=='Facebook']['polarity']2. x2 = df.loc[df['source'] == 'https://www.health.harvard.edu/']['polarity']3. x3 = df.loc[df['source'] == 'https://www.nytimes.com/']['polarity']4. x4 = df.loc[df['source'] == 'https://www.naturalnews.com/']['polarity']5. group_labels = ['Facebook', 'Harvard', 'nytimes', 'naturalnews']6.7. colors = ['rgb(0, 0, 100)', 'rgb(0, 200, 200)', 'rgb(100, 0, 0)', 'rgb(200, 0, 200)']8.9. # Create distplot with custom bin_size 10. fig = ff.create_distplot(11. [x1, x2, x3, x4], group_labels,colors=colors)12.13. fig.update_layout(title_text='polarity', template="plotly_white")14. fig.show()

1. fig = go.Figure()2.3. sources = ['https://www.health.harvard.edu/', 'https://www.nytimes.com/', 'Facebook', 'https://www.naturalnews.com/']4.5. for source in sources:6. fig.add_trace(go.Violin(x=df['source'][df['source'] == source],7. y=df['polarity'][df['source'] == source],8. name=source,9. box_visible=True,10. meanline_visible=True))11. fig.update_layout(title_text='Polarity of four sources', template='plotly_white')12. fig.show()
source_violin.py
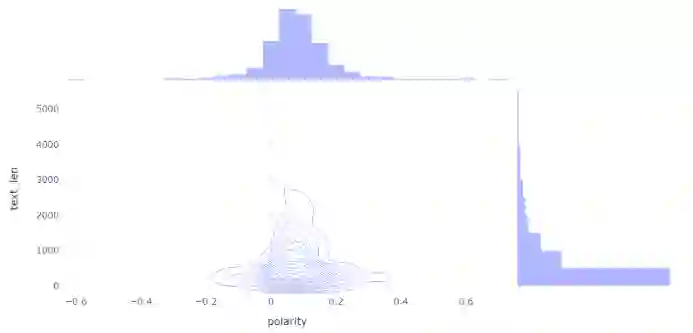
情绪vs文章长度vs真实性
1. fig = px.density_contour(df, x='polarity', y='text_len', marginal_x='histogram', marginal_y='histogram', template='plotly_white')2. fig.update_layout(title_text='Sentiment vs. Article length')3. fig.show()
1. fig = px.scatter(df, x='polarity', y='text_len', color='label', template="plotly_white")2. fig.update_layout(title_text='Sentiment polarity')3. fig.show()
polarity_scatter.py
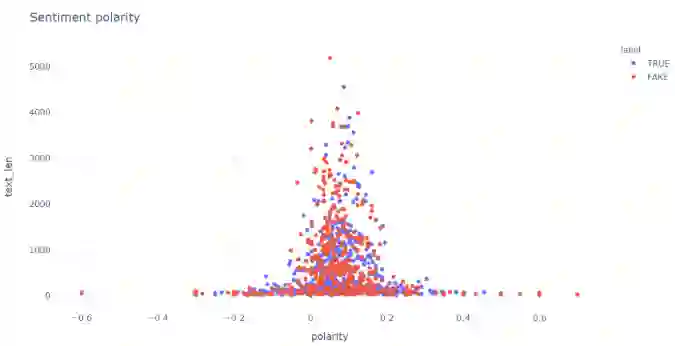
图十三
df.groupby(['source']).mean().sort_values('polarity', ascending=False)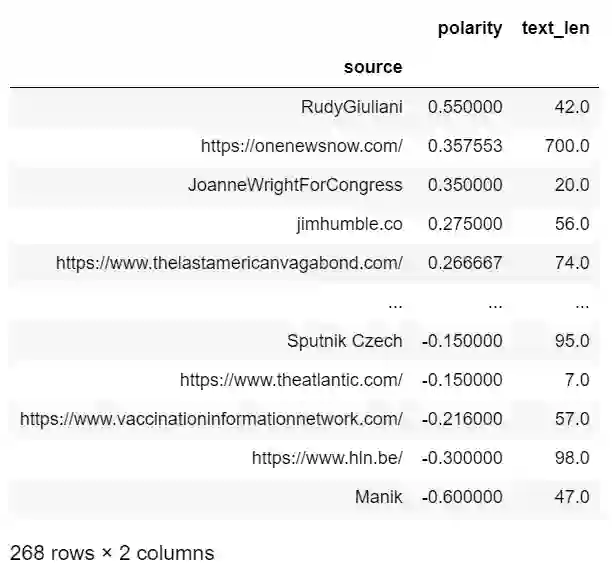
df.loc[df['source'] == 'RudyGiuliani']['text'][880]
1. common_bigram_true = get_top_n_bigram(df.loc[df['label'] == 'TRUE']['text'], 20)2. for word, freq in common_bigram_true:3. print(word, freq)
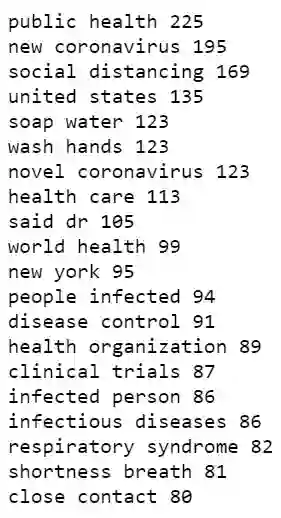
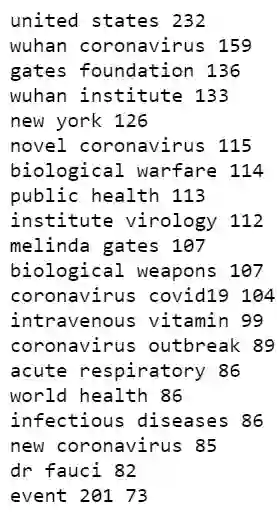
1. common_bigram_fake = get_top_n_bigram(df.loc[df['label'] == 'FAKE']['text'], 20)2. for word, freq in common_bigram_fake:3. print(word, freq)
fake_bigram.py
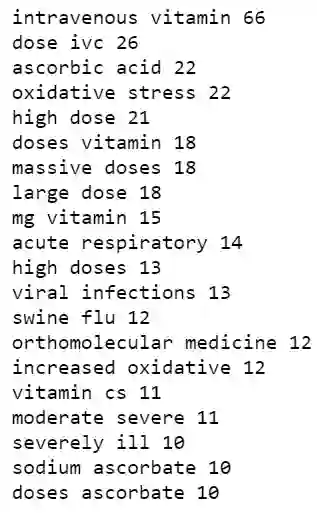
促进治愈:这包括使用大剂量静脉注射维生素C。
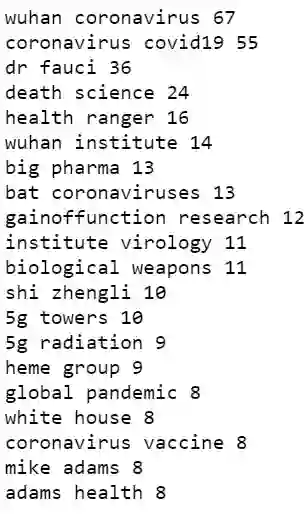
关于起源的推测:这个主题包括声称冠状病毒是在用于生物武器的实验室中制造的,或者是5G技术导致了这种疾病。
关于有影响力人士的谣言:例如比尔·盖茨和福西博士代表制药公司策划了冠状病毒。
应对人们的恐惧:例如梅林达·盖茨基金会和约翰·霍普金斯大学在三个月前通过Event 201预测了冠状病毒。
从我们的数据来看,真实和虚假新闻内容之间的一个明显区别是,虚假新闻似乎更多地使用了人的名字,这表明虚假新闻可能更加个性化。
naturalnews.com vs orthomolecular.org以上两个新闻来源都提倡阴谋论,但是它们却关注不同的主题。
1. naturalnews_bigram = get_top_n_bigram(df.loc[df['source'] == 'https://www.naturalnews.com/']['text'], 20)2. for word, freq in naturalnews_bigram:3. print(word, freq)
natural_bigram.py
1. ortho_bigram = get_top_n_bigram(df.loc[df['source'] == 'http://orthomolecular.org/']['text'], 20)2. for word, freq in ortho_bigram:3. print(word, freq)
ortho_bigram.py
原文标题:
Explore COVID-19 Infodemic
原文链接:
https://towardsdatascience.com/explore-covid-19-infodemic-2d1ceaae2306
译者简介

杨毅远,清华大学自动化系研一在读,本科毕业于华中科技大学自动化学院实验班,研究方向为工业过程检测中的AI算法。喜欢唱歌、喜欢接触新鲜事物的我对于“AI+”格外感兴趣;入门CV和数据挖掘的我,希望接触到更多非自己研究领域内的事物,拓宽自己的知识圈。
——END——