Github 推荐项目 | Jupyter 的 Matplotlib 交互图表扩展
利用 Jupyter 交互式小部件框架,jupyter-matplotlib 可以在 Jupyter notebook 和 Jupyterlab 中实现 matplotlib 的交互功能。
此外,canvas 是一个合适的 Jupyter 交互式小部件,可以定位在交互部件的 Layout 上。
Github 链接:
https://github.com/matplotlib/jupyter-matplotlib
用法:
要启用 jupyter-matplotlib 后端,只需使用 matplotlib:
%matplotlib widget
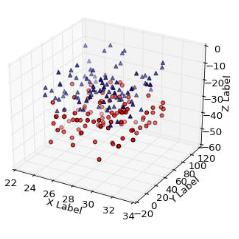
示例:
安装:
使用 conda 安装 ipympl:
conda install -c conda-forge ipympl
# If using the Notebook
conda install -c conda-forge widgetsnbextension
# If using JupyterLab
conda install nodejs
jupyter labextension install @jupyter-widgets/jupyterlab-manager
使用pip安装ipympl:
pip install ipympl
# If using JupyterLab
# Install nodejs: https://nodejs.org/en/download/
jupyter labextension install @jupyter-widgets/jupyterlab-manager
对于开发安装(需要节点)
git clone https://github.com/matplotlib/jupyter-matplotlib.git
cd jupyter-matplotlib
pip install -e .
jupyter nbextension install --py --symlink --sys-prefix ipympl
jupyter nbextension enable --py --sys-prefix ipympl
jupyter labextension install @jupyter-widgets/jupyterlab-manager --no-build
jupyter labextension link ./js
cd js && npm run watch
# Launch jupyterlab as `jupyter lab --watch` in another terminal
想阅读更多编程文章文章?
欢迎点击“阅读原文”
或者移步 AI 研习社社区~


