利用 Python 预测英雄联盟胜负,分析了 5 万多场比赛才得出的数据!


今天教大家用Python预测英雄联盟比赛胜负。
今天教大家用Python预测英雄联盟比赛胜负。
Show me data,用数据说话
今天我们聊一聊 Python预测LOL胜负
点击下方视频,先睹为快:
目前,英雄联盟S10全球总决赛正在火热进行中,最终决赛于10月31日在浦东足球场举行。作为当下最火热的电竞赛事,这点燃了全球无数玩家的关注,相信没有哪个英雄联盟玩家会错过这场受众超广、影响力超大的国际电竞赛事。LPL究竟能否在家门口拿下第三座世界赛奖杯也成了许多玩家关注的话题。

对于每场比赛,大家最关注的莫过于最后的胜负了,那么比赛的胜负能否可以预测呢?
今天,我们就分析了5万多场英雄联盟的排名比赛,教你如何用Python预测比赛胜负。

项目介绍
Towers(防御塔):每支队伍总共有11座防御塔
Inhibitor(水晶):每条道有一个水晶
Elemental Drakes/Elder Dragon(大龙/远古龙)
Rift Herald(峡谷先锋)
Baron Nasho(纳什男爵)
Nexus(基地)

数据集概述
数据集收集了超过50000个从游戏英雄联盟排位游戏的数据,字段主要包含以下数据:
-
Game ID:游戏ID -
Creation Time:创建时间
-
Game Duration (in seconds):游戏持续时间(秒)
-
Season ID:赛季ID
-
Winner (1=team1, 2=team2):获胜队伍
-
First Baron, dragon, tower, blood, inhibitor and Rift Herald (1 = team1, 2 = team2, 0 = none):第一条纳什男爵,大龙,塔,一血,水晶,峡谷先锋
-
Champions and summoner spells for each team (Stored as Riot's champion and summoner spell IDs):每只队伍选择的英雄和召唤术
-
The number of tower, inhibitor, Baron, dragon and Rift Herald kills each team has:塔,水晶,男爵,大龙和峡谷先锋击杀数
-
The 5 bans of each team (Again, champion IDs are used):每个队伍的禁用英雄

数据读入和预览
# 数据整理import numpy as npimport pandas as pd# 可视化import matplotlib.pyplot as pltimport seaborn as snsimport plotly as pyimport plotly.graph_objs as go# 建模from sklearn.tree import DecisionTreeClassifierfrom sklearn.model_selection import train_test_split, GridSearchCVfrom sklearn.metrics import confusion_matrix, classification_report
# 读入数据df = pd.read_csv('./archive/games.csv')df.head()
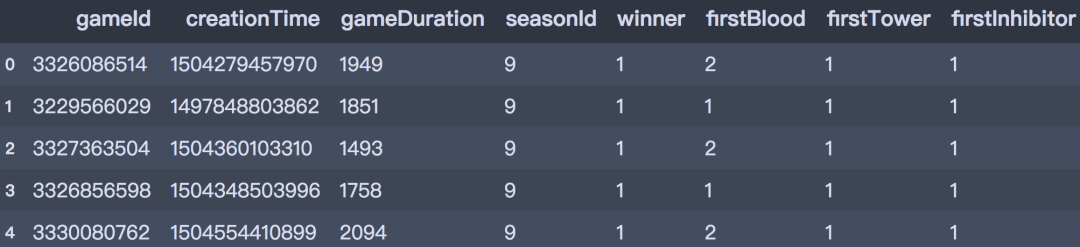
df.shape(51490, 61)

数据可视化
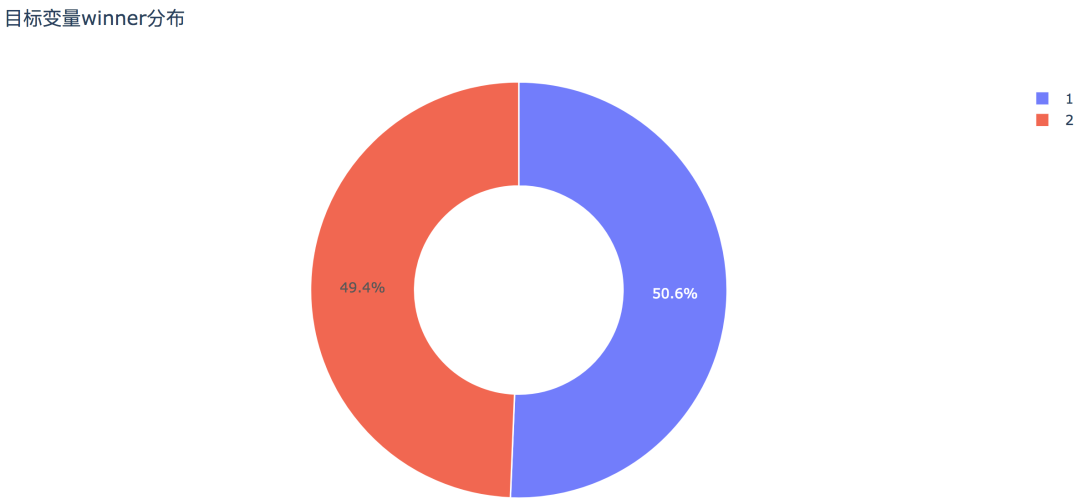
# 饼图trace0 = go.Pie(labels=df['winner'].value_counts().index,values=df['winner'].value_counts().values,hole=0.5,opacity=0.9,marker=dict(line=dict(color='white', width=1.3)))layout = go.Layout(title='目标变量winner分布')data = [trace0]fig = go.Figure(data, layout)py.offline.plot(fig, filename='./html/整体获胜情况分布.html')
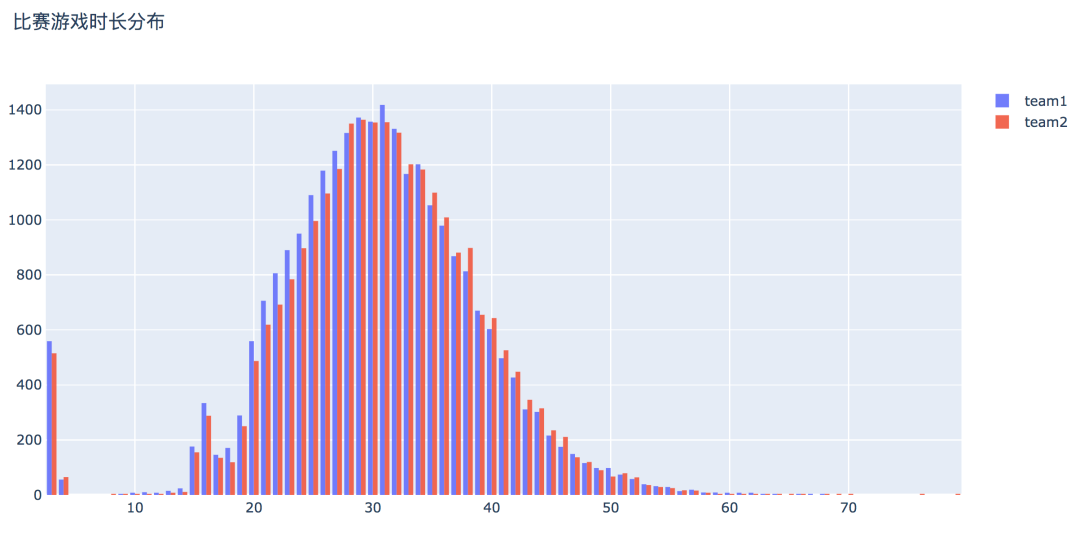
df['game_duration'] = round(df['gameDuration'] / 60)# 选择数据x1 = df[df['winner'] == 1]['game_duration']x2 = df[df['winner'] == 2]['game_duration']# 直方图trace0 = go.Histogram(x=x1, bingroup=25, name='team1', opacity=0.9)trace1 = go.Histogram(x=x2, bingroup=25, name='team2', opacity=0.9)layout = go.Layout(title='比赛游戏时长分布')data = [trace0, trace1]fig = go.Figure(data, layout)py.offline.plot(fig, filename='./html/游戏时长分布.html')
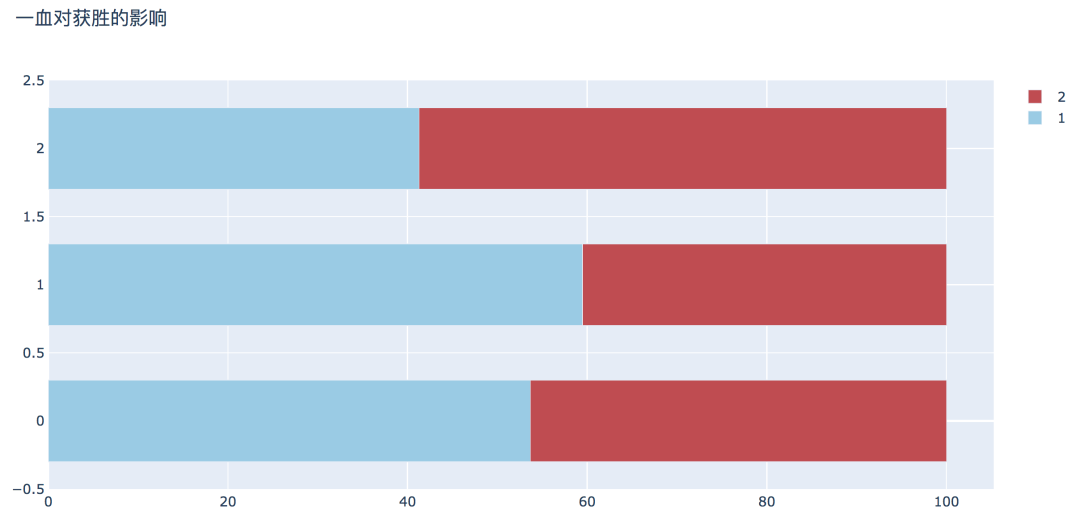
plot_bar_horizontal(input_col='firstBlood', target_col='winner', title_name='一血对获胜的影响') 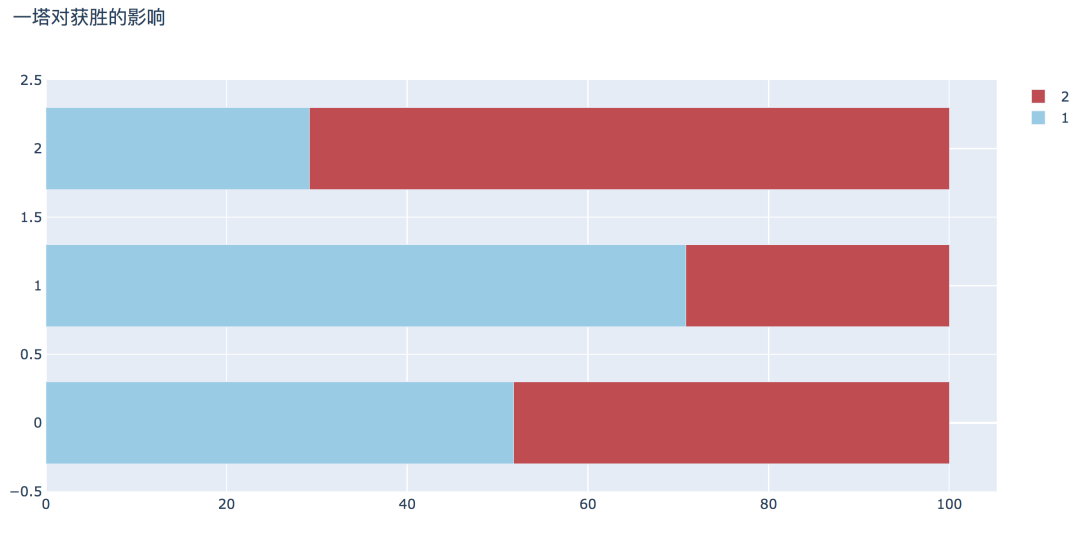
plot_bar_horizontal(input_col='firstTower', target_col='winner', title_name='一塔对获胜的影响')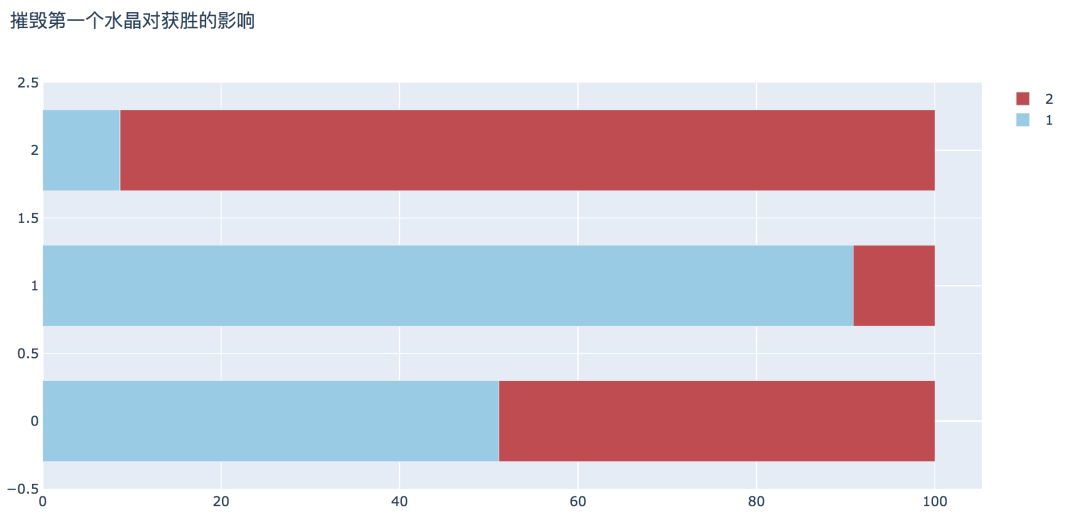
plot_bar_horizontal(input_col='firstInhibitor', target_col='winner', title_name='摧毁第一个水晶对获胜的影响') 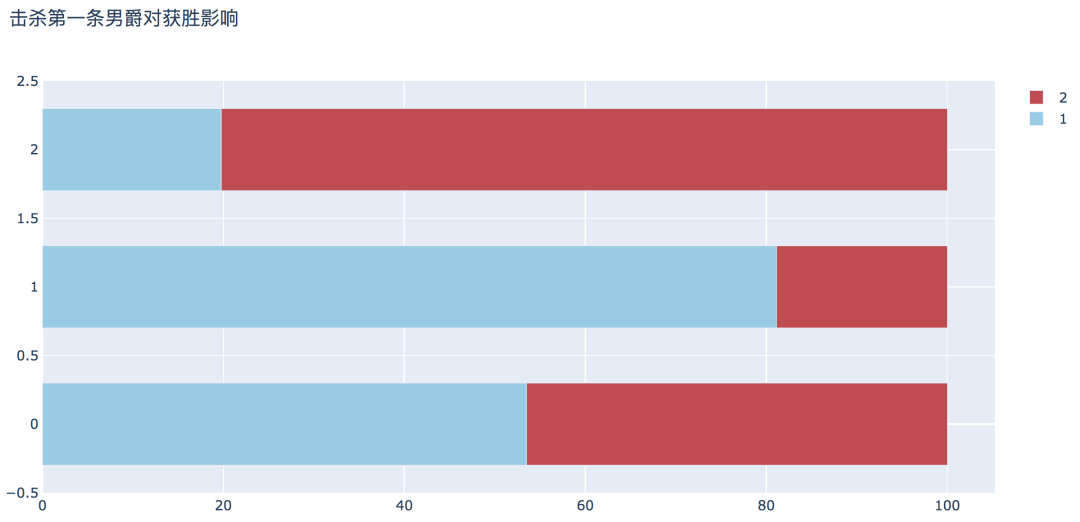
plot_bar_horizontal(input_col='firstBaron', target_col='winner', title_name='击杀第一条男爵对获胜影响')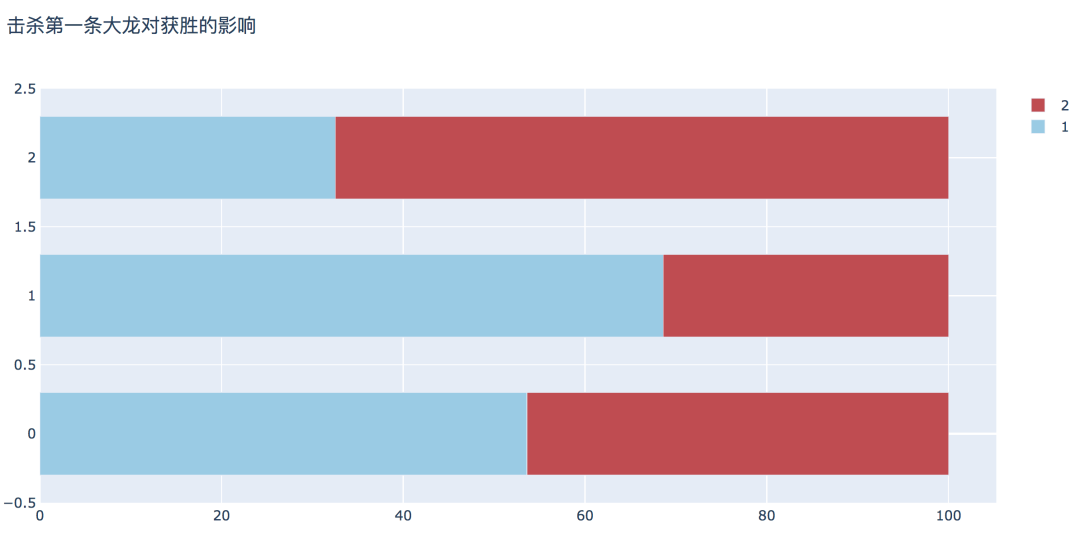
plot_bar_horizontal(input_col='firstDragon', target_col='winner', title_name='击杀第一条大龙对获胜的影响') 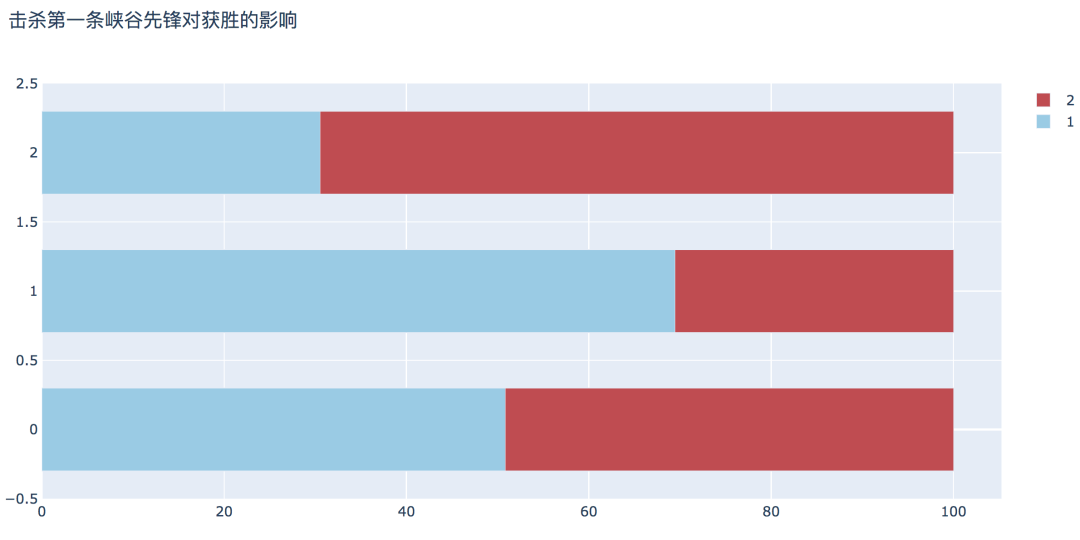
plot_bar_horizontal(input_col='firstRiftHerald', target_col='winner',title_name='击杀第一条峡谷先锋对获胜的影响')
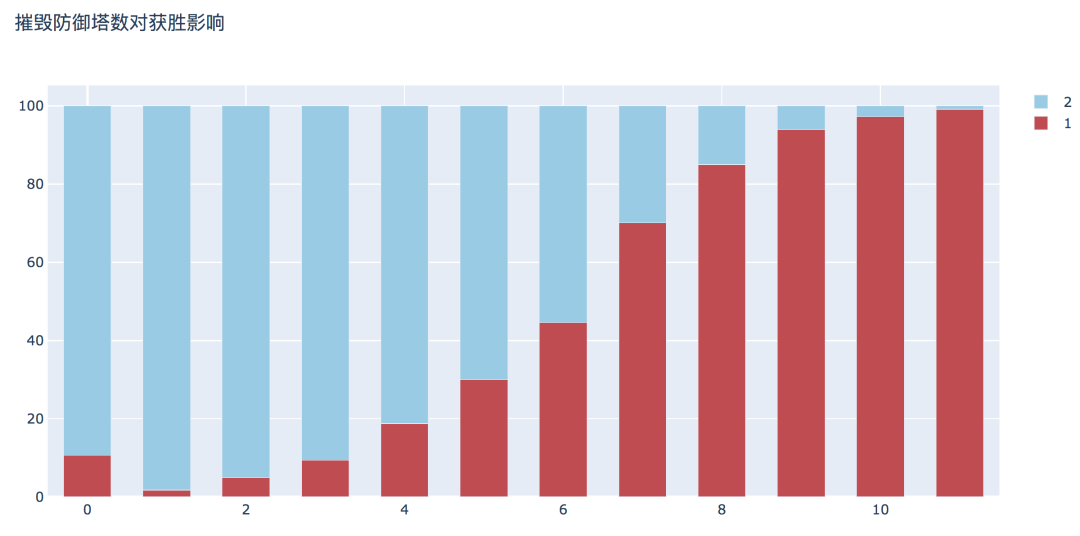
plot_bar_vertical(input_col='t1_towerKills', target_col='winner', title_name='摧毁防御塔数对获胜影响') 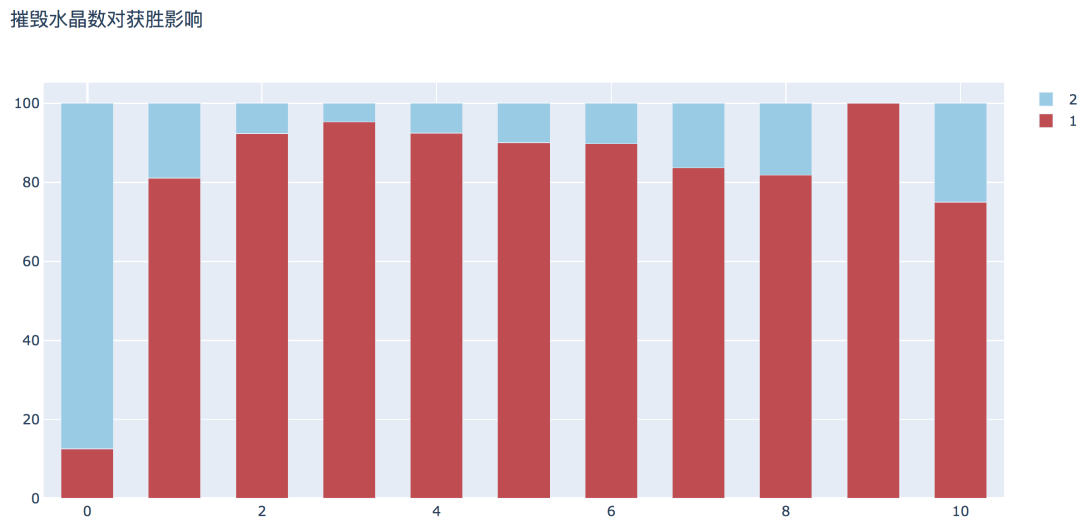
plot_bar_vertical(input_col='t1_inhibitorKills', target_col='winner', title_name='摧毁水晶数对获胜影响')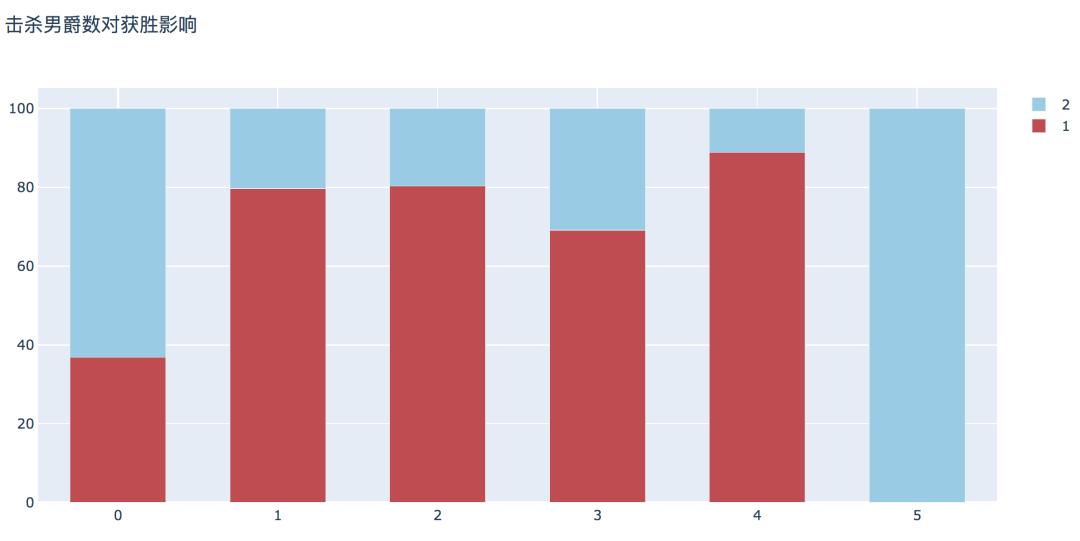
plot_bar_vertical(input_col='t1_baronKills', target_col='winner', title_name='击杀男爵数对获胜影响')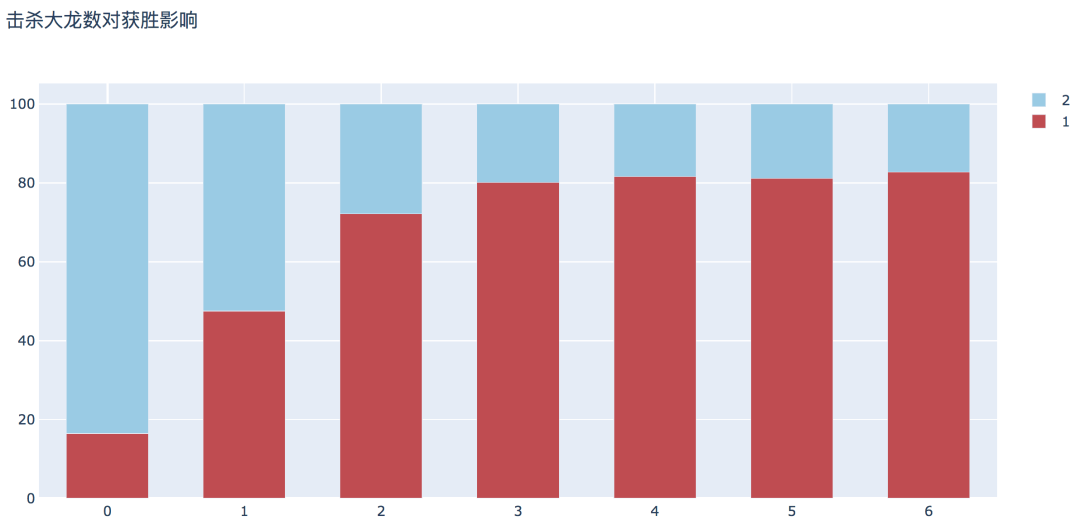
plot_bar_vertical(input_col='t1_dragonKills', target_col='winner', title_name='击杀大龙数对获胜影响')
# 删除时间少于15分钟和分类数较少的记录df = df[(df['gameDuration'] >= 900) & (df['t1_baronKills'] != 5)]print(df.shape)
(50180, 62)
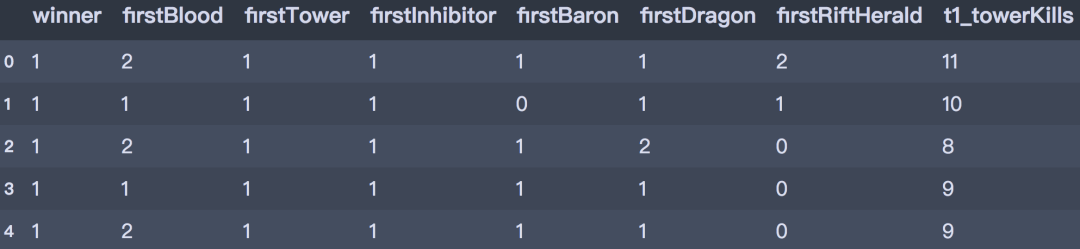
# 筛选建模变量df_model = df[['winner', 'firstBlood', 'firstTower', 'firstInhibitor', 'firstBaron', 'firstDragon', 'firstRiftHerald', 't1_towerKills', 't1_inhibitorKills','t1_baronKills', 't1_dragonKills', 't2_towerKills', 't2_inhibitorKills', 't2_baronKills', 't2_dragonKills' ]] df_model.head()
# 划分训练集和测试集x = df_model.drop('winner', axis=1)y = df_model['winner']X_train, X_test, y_train, y_test = train_test_split(x, y, test_size=0.2, stratify=y, random_state=0)print(X_train.shape, X_test.shape, y_train.shape, y_test.shape)
(40144, 14) (10036, 14) (40144,) (10036,)# 参数parameters = {'splitter': ('best', 'random'),'criterion':('gini', 'entropy'),'max_depth':[*range(1, 20, 2)],}# 建立模型clf = DecisionTreeClassifier(random_state=0)GS = GridSearchCV(clf, parameters, cv=10)GS.fit(X_train, y_train)
        GridSearchCV(cv=10, estimator=DecisionTreeClassifier(random_state=0),             param_grid={'criterion': ('gini', 'entropy'),                         'max_depth': [1, 3, 5, 7, 9, 11, 13, 15, 17, 19],                         'splitter': ('best', 'random')})


        # 输出最佳得分 print("best score: ", GS.best_score_)print("best param: ", GS.best_params_)


        best score:  0.9770077890521407best param:  {'criterion': 'gini', 'max_depth': 7, 'splitter': 'best'}
        # 最佳模型best_clf = DecisionTreeClassifier(criterion="gini", max_depth=7, splitter="best")best_clf.fit(X_train,y_train) print("score:", best_clf.score(X_test,y_test))


        score: 0.9799721004384216
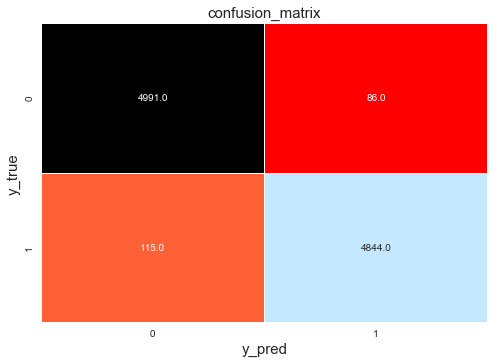
# 输出分类报告y_pred = best_clf.predict(X_test)cm = confusion_matrix(y_test, y_pred)cr = classification_report(y_test, y_pred)print('Classification report : \n', cr)
Classification report :precision recall f1-score support1 0.98 0.98 0.98 50772 0.98 0.98 0.98 4959accuracy 0.98 10036macro avg 0.98 0.98 0.98 10036weighted avg 0.98 0.98 0.98 10036
# 热力图g1 = sns.heatmap(cm, annot=True, fmt=".1f", cmap="flag", linewidths=0.2, cbar=False)g1.set_ylabel('y_true', fontdict={'fontsize': 15})g1.set_xlabel('y_pred', fontdict={'fontsize': 15})g1.set_title('confusion_matrix', fontdict={'fontsize': 15})
Text(0.5, 1, 'confusion_matrix')
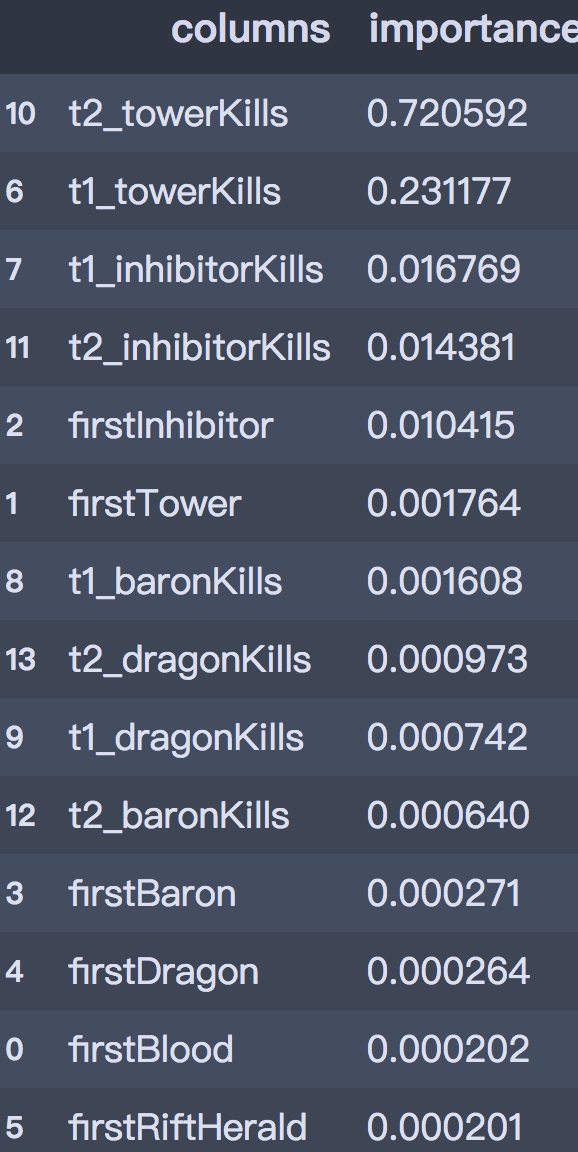
# 输出属性重要性imp = pd.DataFrame(list(zip(X_train.columns, best_clf.feature_importances_))) imp.columns = ['columns', 'importances']imp = imp.sort_values('importances', ascending=False)imp
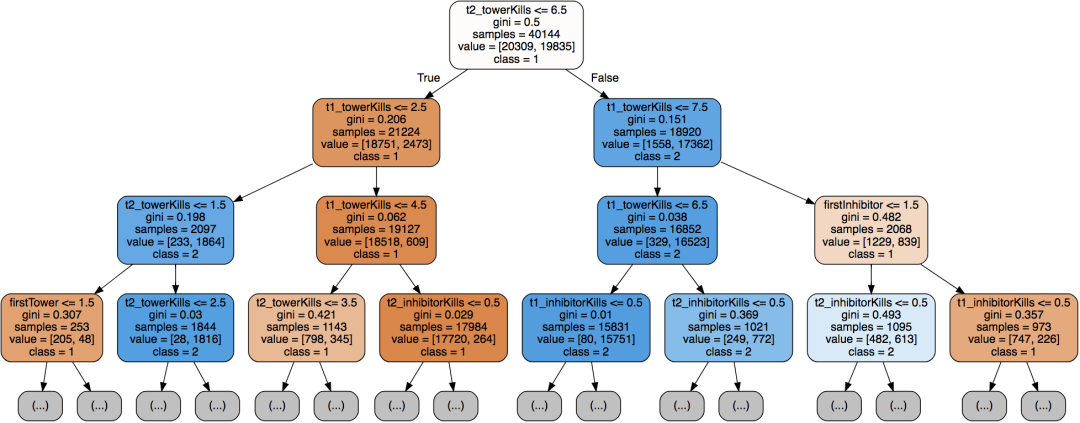
# 可视化import graphvizfrom sklearn import treedot_data = tree.export_graphviz(decision_tree=best_clf, max_depth=3,out_file=None,feature_names=X_train.columns,class_names=['1', '2'],filled=True,rounded=True)graph = graphviz.Source(dot_data)graph

# 新数据new_data = [[1, 1, 2, 1, 1, 1, 10, 2, 1, 4, 7, 2, 1, 1]]c = best_clf.predict_proba(new_data).reshape(-1, 1)print("winner is :" , best_clf.predict(x1))print("First team win probability is % ", list(c[0] * 100),"\nSecond team win probability is %:",list(c[1] * 100))
winner is : [1]First team win probability is % [89.87341772151899]Second team win probability is %: [10.126582278481013]


更多精彩推荐
![]()
点分享
![]()
点点赞
![]()
点在看


登录查看更多
相关内容
Arxiv
0+阅读 · 2021年2月4日
Arxiv
0+阅读 · 2021年1月29日
Arxiv
8+阅读 · 2018年8月22日


相关VIP内容
相关资讯
相关论文
Arxiv
0+阅读 · 2021年2月4日
Arxiv
0+阅读 · 2021年1月29日
Arxiv
8+阅读 · 2018年8月22日