通俗理解决策树 - Decision Tree- (向XGBoost冲啊)【1】

开头语:决策树一直是很经典的模型之一。除了在一些问题上可以有很好的预测效果,对于预测结果的可解释性也是相当友好的。这一系列的笔记仍然致力于简洁 + 尽量能说清楚怎么回事。
一段发自肺腑感谢的话:非常感谢Youtube上“StatQuest with Josh Starmer”公众号,发布了很多通俗易懂的视频(从决策树一直到XGBoost也在其中)。这一系列的笔记也是很大程度的上基于他的讲解和列举的例子。
笔记整理大计划:
Decision Trees (Classification and Regression Trees)
Random Forest (Building, Using and Evaluating; Missing Data and Clustering)
AdaBoost
Gradient Boost (GBDT; Regression and Classification)
XGBoost Trees (Regression, Classification, Optimisations)
大实话:最终目的是要整理完从Decision Tree到XGBoost(完整的计划可以在下面看到)。当前这篇是一个开始(Decision Trees)。这一系列的笔记也会先发在微信公众号上。最终会把所有的笔记逐渐整理成一个单独的大网页上,方便复习和搜索(可以点击文末【阅读原文】,然后找到“Fantastic Trees (Decision Trees, Random Forest, Adaboost, Gradient Boosting DT-GBDT, XGBoost)”)
正文:
This note summarises the Youtube Videos published by Josh Starmer (Youtube Account: StatQuest with Josh Starmer). I would like to say a big thank you to him and his super useful videos!
Table of Contents
Decision Trees
Main Idea (this article is focusing on this one)
What If We Have Numeric Data?
Ranked Data
Multiple Choice Data
Feature Selection and Missing Data
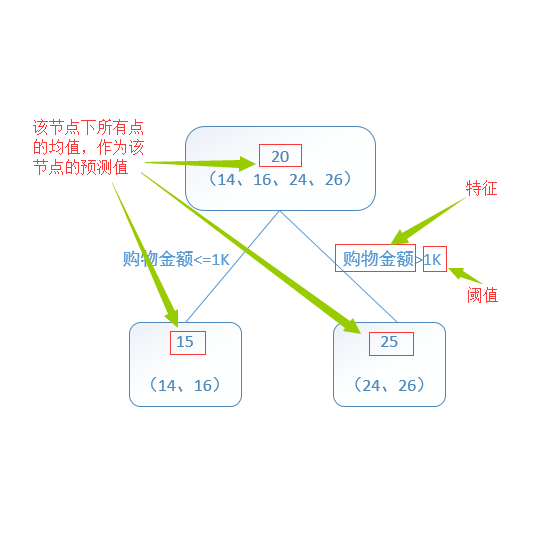
Regression Trees
Prune Regression Trees
Random Forests
Building
Using
Evaluating
Missing Data and Clustering
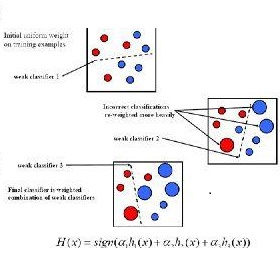
AdaBoost
Gradient Boost
Regression Main Ideas
Regression Details
Classification
Classification Details
XGBoost
XGBoost Trees for Regression
XGBoost Trees for Classification
Mathematical Details
Optimisation
----------
[Decision Trees - Main Idea]
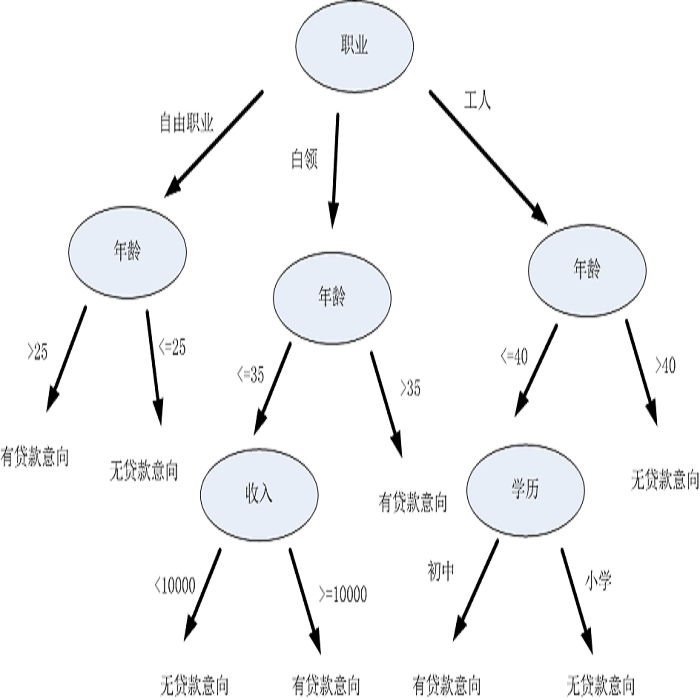
An Example of Decision Tree:
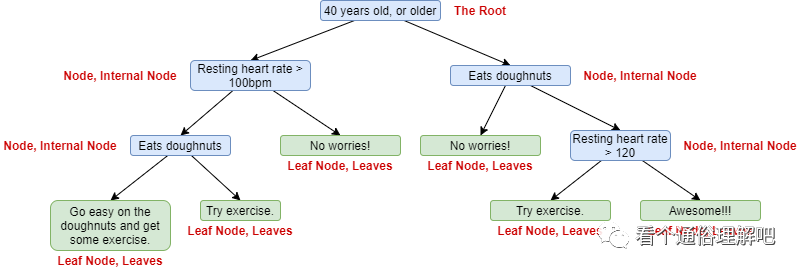
The decision tree in this example combines numeric data with category data.
How to select the root when starting to build a tree?
we will use the following toy data to illustrate how to build a tree. In this dataset, we have 3 variables (i.e., Chest Pain, Good Blood Circulation and Blocked Arte) can be used to predict whether a person has the Heart Disease.
| Chest Pain | Good Blood Circulation | Blocked Arteries | Heart Disease |
|---|---|---|---|
| NO | NO | NO | NO |
| YES | YES | YES | YES |
| YES | YES | NO | NO |
| YES | NO | ??? | YES |
| etc... | etc... | etc... | etc... |

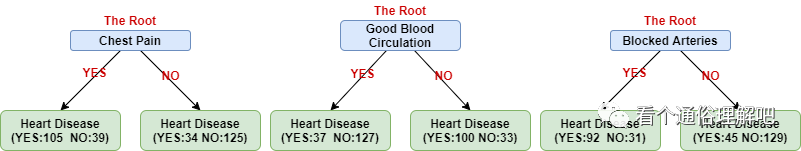
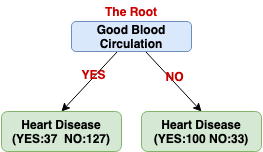
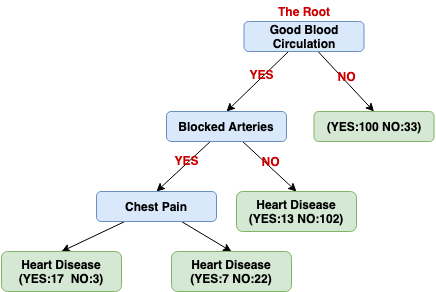
The first and important thing is that we need to decide which variable to use as the ROOT (see the Figure above). In order to solve this problem, let's see what the trees will look like if we use each variable (see the Figure below). Because we have 3 variables (or features), we will get 3 possible trees. Thus, we need to select the best one among these three trees.
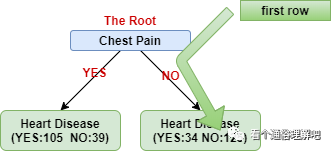
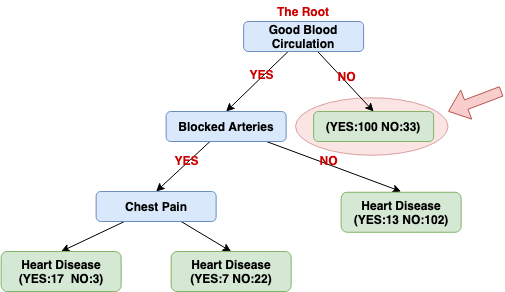
You may notice the number in the leaves. The number is how many rows fall into that category. For example, the first row in the dataset (Chest Pain: No, ..., Heart Disease: No) will go to the leave as shown below.
Back to our problem, how to select the root note, i.e., how to select a good variable as the root of our tree.
As you can see, "NONE of the leaf nodes are 100% YES Heart Disease or 100% NO Heart Disease", these nodes are considered "impure". In order to select the best variable for the root node, we need to compare the impurity of each tree. We want the leaves to be as pure as possible, therefore we would select the tree which has the lowest impurity.
One of the most common methods to measure the impurity is Gini.
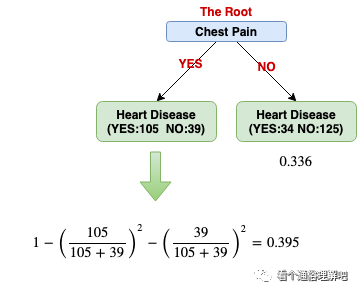
Next, we will compute the Gini of each leaf, i.e., the impurity of each leaf in each tree. The formula of computing the Gini for a leaf is:
1 - (the probability of YES) - (the probability of NO)
The figure below shows the Gini values of all the leaves in a tree:
Once we finish computing the Gini of each leaf, we can compute the Gini of the root node (basically, it is a sum of weighted leaf Gini values):
Gini impurity for Chest Pain = weighted average of Gini impurities for the leaf nodes =
We can repeat the same procedure on the other trees and get the Gini impurity of Good Blood Circulation (0.360) and Blocked Arteries (0.381). Because the variable Good Blood Circulation has the lowest impurity, in other words, it can separate/divide patients with and without heart disease the best.
Continue building the tree:
Next, we need to figure out how well Chest Pain and Blocked Arteries separate the patients of these (37 with heart disease+127 without heart disease =164 patients).
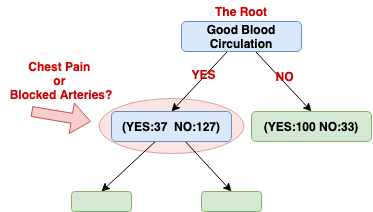
We will do the same procedure to investigate which variable (Chest Pain or Blocked Arteries) is the best for separating the 164 patients for this node.
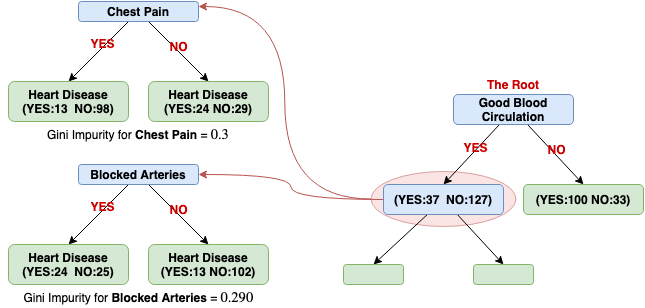
Since using the variable Blocked Arteries has the lowest Gini impurity, we will use this variable for this node to separate patients.
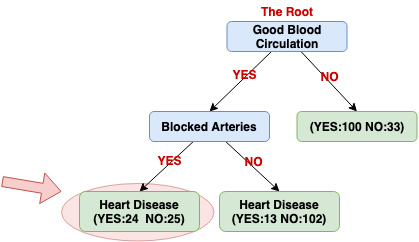
Currently, all we have left is the Chest Pain variable, we can see the last variable can well separate the 49 patients (24 + 25 = 49).
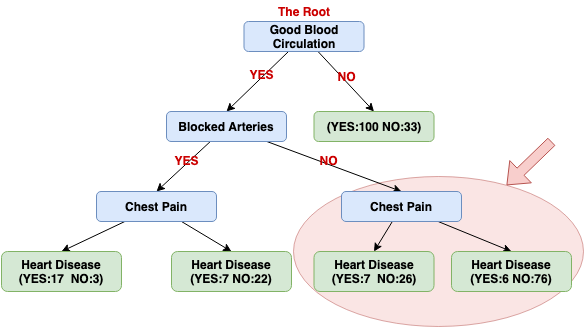
Now let us see what happens when we use Chest Pain to divide these 115 patients (13+102=115). (Note: the vast majority of the patients in this node (89%) don't have heart disease.
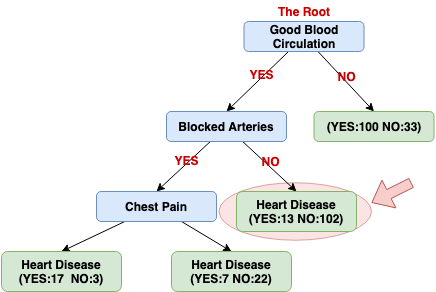
Do these new leaves separate the 115 patients better than not separating the patients by Chest Pain?
Let us compare the Gini impurity of these 2 situations:
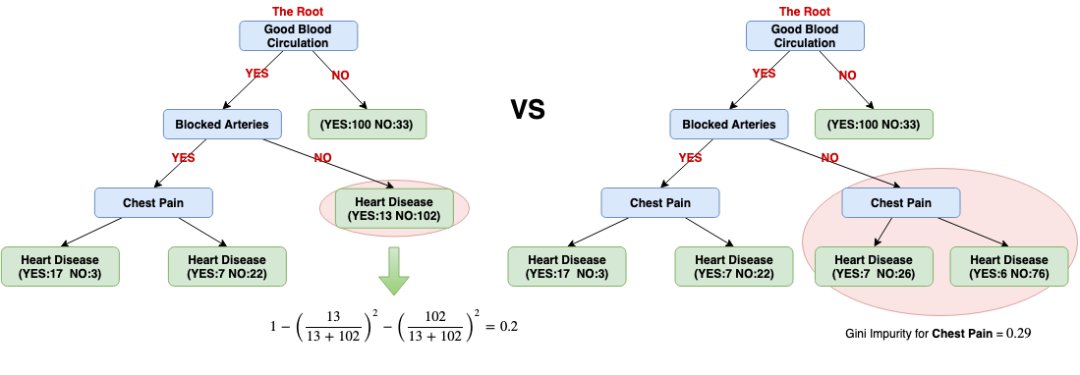
Because the impurity (0.2) is lower when we don't separate patients using Chest Pain here, we will not do the separation.
So, currently, the entire left side of the tree is finished and we can actually run the exactly the same steps as we did on the left side for the right side.
Next article will be: what if we have numeric data?
----------
----------
推荐阅读
数学之美中盛赞的 Michael Collins 教授,他的NLP课程要不要收藏?
From Word Embeddings To Document Distances 阅读笔记
模型压缩实践系列之——bert-of-theseus,一个非常亲民的bert压缩方法
可解释性论文阅读笔记1-Tree Regularization
关于AINLP
AINLP 是一个有趣有AI的自然语言处理社区,专注于 AI、NLP、机器学习、深度学习、推荐算法等相关技术的分享,主题包括文本摘要、智能问答、聊天机器人、机器翻译、自动生成、知识图谱、预训练模型、推荐系统、计算广告、招聘信息、求职经验分享等,欢迎关注!加技术交流群请添加AINLPer(id:ainlper),备注工作/研究方向+加群目的。